Fig. 2.

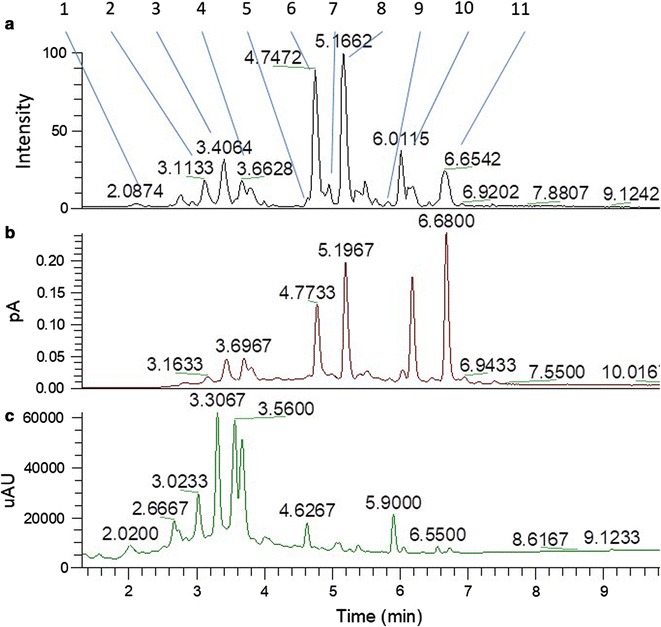
Multiplexed UHPLC chromatogram of TMR extract. a FTMS in ESI negative mode. b CAD detector. c PDA chromatogram (200–400 nm). Peaks numbering is according to Table 3

Multiplexed UHPLC chromatogram of TMR extract. a FTMS in ESI negative mode. b CAD detector. c PDA chromatogram (200–400 nm). Peaks numbering is according to Table 3