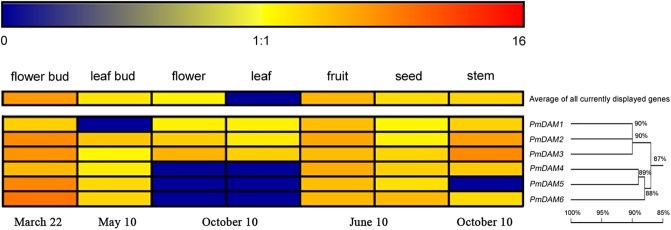
FIGURE 3.
Expression profiles of P. mume DAM genes in seven organs. The expression levels of PmDAMs were gained using quantitative real-time PCR method. The log2-transformed counts of the expression levels of PmDAMs were represented by the color scale. Red indicated high expression levels and Blue suggested low levels. Homology tree was constructed by DNAMAN 7.0 program using six P. mume DAM genes. Numbers above branches represented bootstrap value.

