
Figure 1. Loss-of-Function Variants in ANGPTL3 and Lipid Levels in Humans.
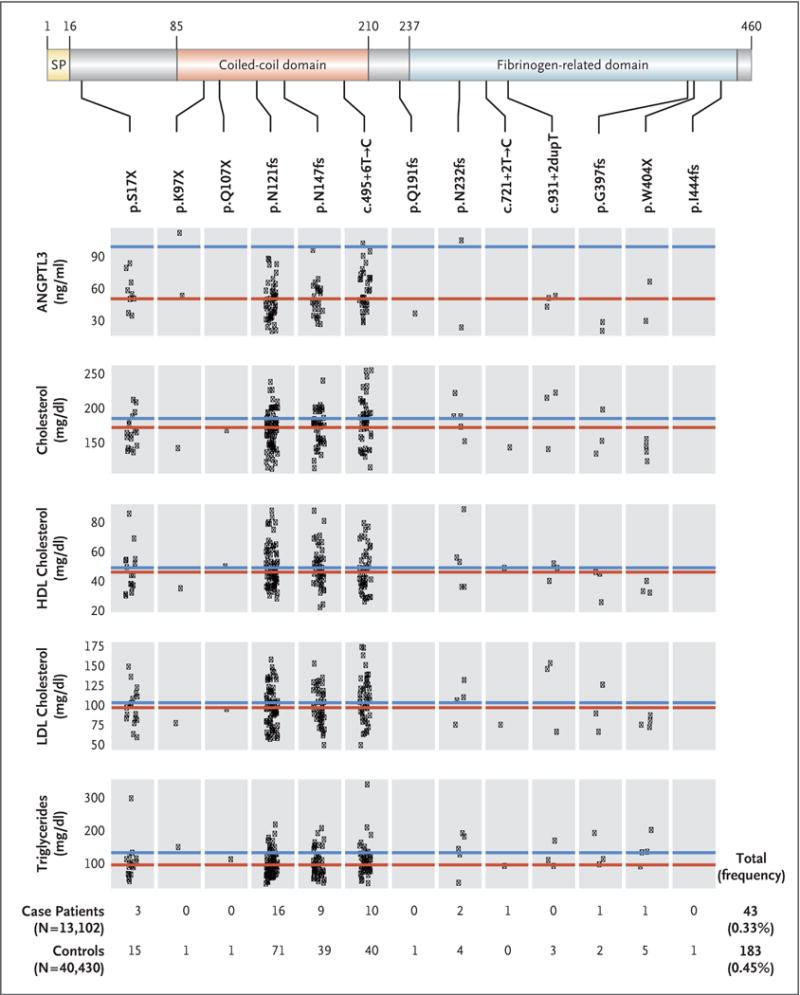
The top of the diagram shows the organization of the ANGPTL3 protein, which is 460 amino acids long. Functional sections of the protein are marked in varying colors and demarcated with lines labeled to show the numbering of the amino acid sequence for each section. Beneath the protein diagram, the individual protein-sequence variants are listed in order of their position in the protein. Beneath the protein-sequence variants are plots of ANGPTL3 concentration and lipid levels. The red lines indicate the median value for each level among all carriers of loss-of-function variants. Each point represents a trait value for a single carrier of the loss-of-function variant specified above each box. The blue line indicates the median value for each trait for all sequenced persons not carrying a loss-of-function variant in ANGPTL3. To convert the values for cholesterol to millimoles per liter, multiply by 0.02586. To convert the values for triglycerides to millimoles per liter, multiply by 0.01129. HDL denotes high-density lipoprotein, LDL low-density lipoprotein, and SP signal peptide.