
Figure 1.
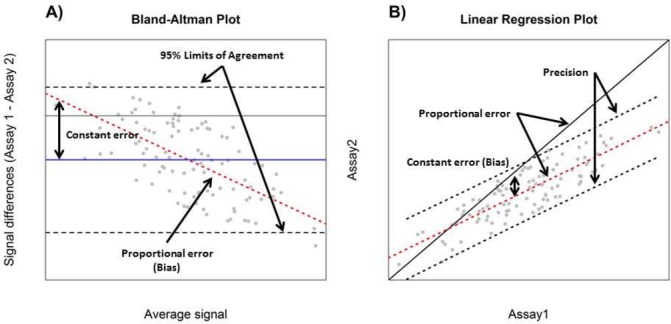
Interpretation of Bland-Altman (A) and Deming/simple linear regression (B) plots for the purpose of assay comparison. Black dashed lines display the distribution of differences in measurements by the two assays in a Bland-Altman plot and are used to estimate the degree of agreement (A). Constant error (solid blue line), proportional error (red dashed line) and 95% limits of agreement (black dashed line) are displayed in Bland-Altman plot (A). In a correlation plot, the slope of the red dashed line is compared with 1 (shown by the black solid line indicating perfect agreement) (B). Although constant error is not directly visualised in a correlation plot, the position of the red dashed line in relation to the black solid line (perfect agreement) may be used as a surrogate (A). In a Bland-Altman plot, the blue line indicates constant error or the average difference in measurements by the two assays (B). Precision of an assay may be estimated using degree of agreement (A) or prediction intervals (B) (black dashed lines) for spike and recovery experiments.