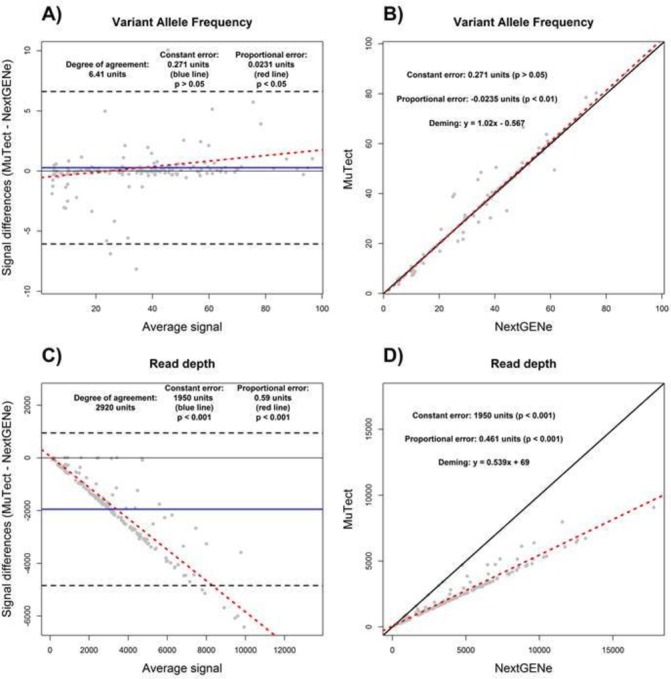
Figure 3.

Bioinformatics tools comparison analysis using the Bland-Altman (A and C) and Deming linear regression methods (B and D). The variant allele frequency measurements (A and B) and read depth coverage (C and D) as determined by BWA-MuTect and NextGENe are displayed. Constant error (solid blue line), proportional error (red dashed line) and degree of agreement (black dashed line) are displayed in Bland-Altman plot. For correlation plot, perfect correlation (ie, slope of 1) (black solid line) and the Deming linear regression (red dashed line) are displayed. The degree of agreement is estimated by the prediction intervals (black dashed lines). The presence and magnitudes of performance characteristics are displayed for both Bland-Altman and correlation plots.
