
Figure 4.
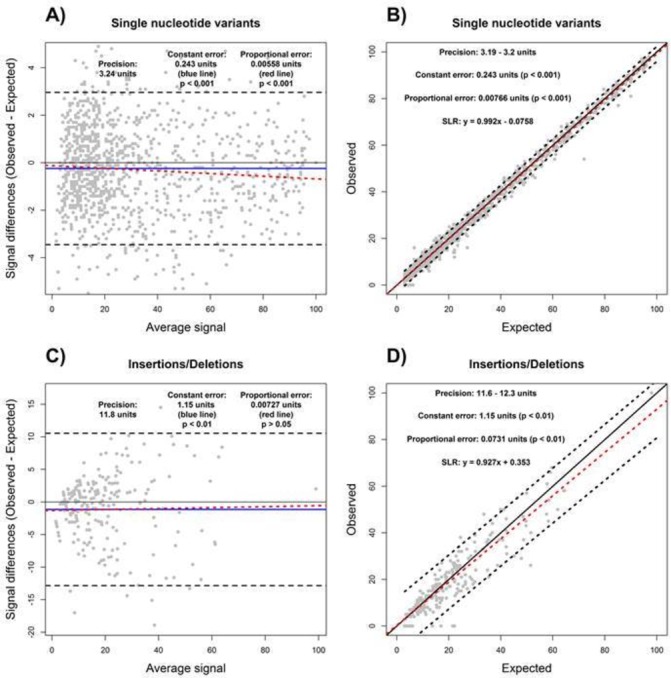
Determination of assay accuracy and precision using Bland-Altman (A and C) and simple linear regression (B and D) methods. The variant allele frequency measurements from a cell line dilution experiment for single nucleotide variants (A and B) and insertions/deletions (C and D) were used to estimate assay accuracy and precision. Degree of agreement (A and C) and prediction intervals (B and D) were used to estimate precision based on expected (theoretical) and observed (empirical) values. Accuracy, including constant (blue line) and proportional (red dashed line) errors, are displayed in both Bland-Altman and correlation plots.