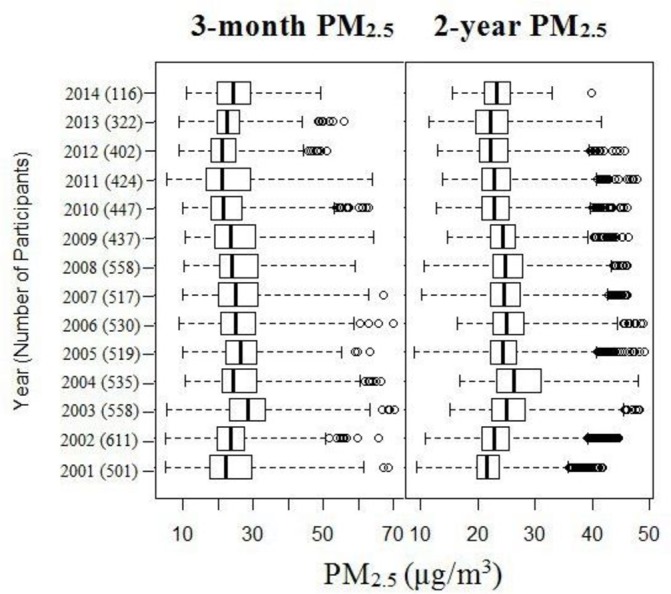
Figure 2.

Distribution of PM2.5 from 2001 to 2014; 3-month refers to the month of and the 2 months before the visit; 2-year refers to the year of and the year before the visit. Boxes cover the 25–75th percentile (IQR) with a centre line for the median concentration. Whiskers extend to the highest observation within 3 IQR of the box, with more extreme observations shown as circles. PM2.5, particulate matter with an aerodynamic diameter <2.5 μm.
