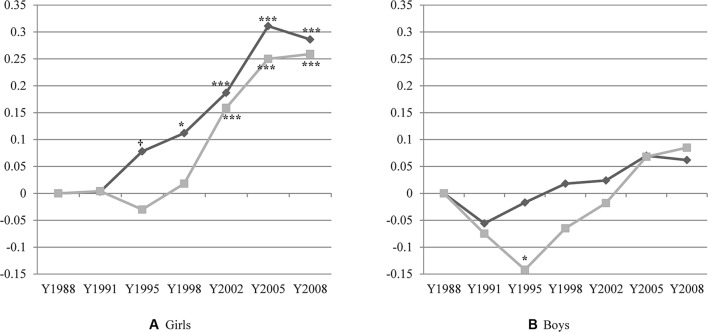
Figure 3.
Psychosomatic problems according to years of investigation. The upper line indicates unstandardised regression coefficients prior to adjusting for the effects of worry (model 2 in table 1). The lower line indicates unstandardised regression coefficients after adjusting for the effects of worry (model 3 in table 1). Note that statistical significance refers to the difference between the reference year (1988) and the selected year, not the difference between before and after adjustment for worry about family finances in the corresponding year. †P<0.10 *P<0.05 *** P<0.001.

