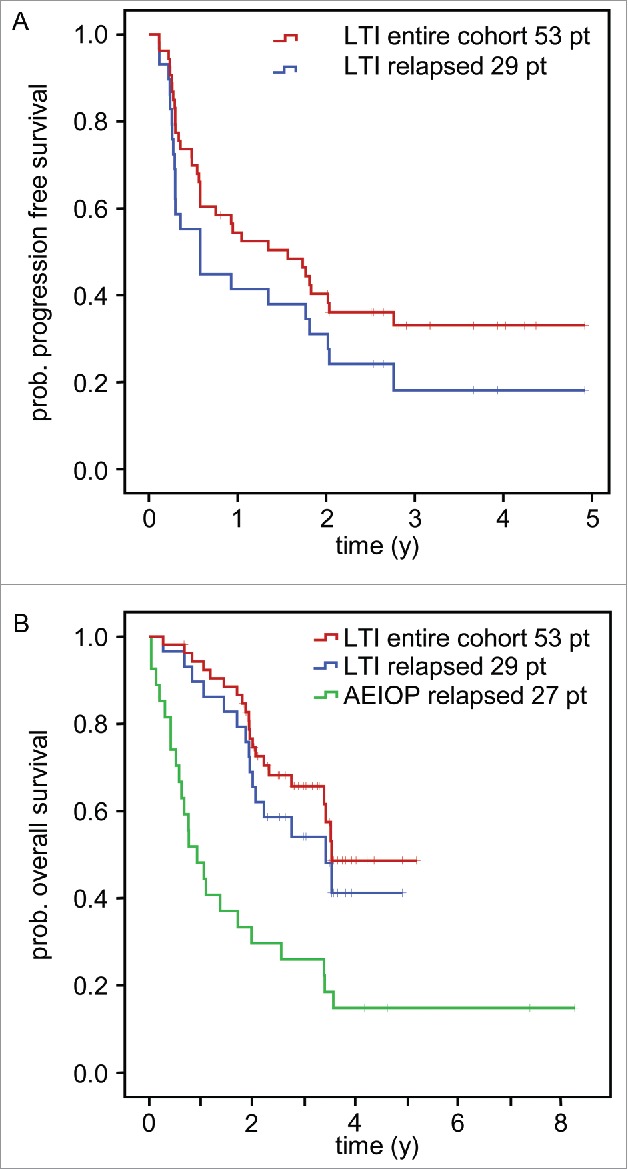
Figure 2.

Analysis of survival and time to progression following LTI of ch14.18/CHO. Patients treated by LTI of 100 mg/m2 ch14.18/CHO in combination with 6 × 10⁶ IU/m2 s.c. IL-2 (d1–5; 8–12) and oral 13-cis RA (d19–32) were analyzed for progression-free survival (PFS) (A) and overall survival (OS) (B) using the Kaplan-Meier method. Patients of the entire cohort (n = 53) and patients with relapsed status at base line (n = 29) were analyzed separately. A) PFS curves of the entire LTI cohort (red) and relapsed patients (blue) (top panel). B) OS of the entire LTI cohort (red) and relapsed patients (blue) was compared to relapsed patients of the AIEOP data base not treated with ch14.18/CHO (green).21 The starting point of the AIEOP relapsed patients equals to the date of first relapse plus the median time between relapse and start of ch14.18/CHO therapy for the LTI patients (1 y 7 d). Patients in the AIEOP relapsed group who died before the auxiliary starting point were excluded. The difference between LTI relapsed- and AIEOP relapsed- patients was statistically significant (P = 0.002).
