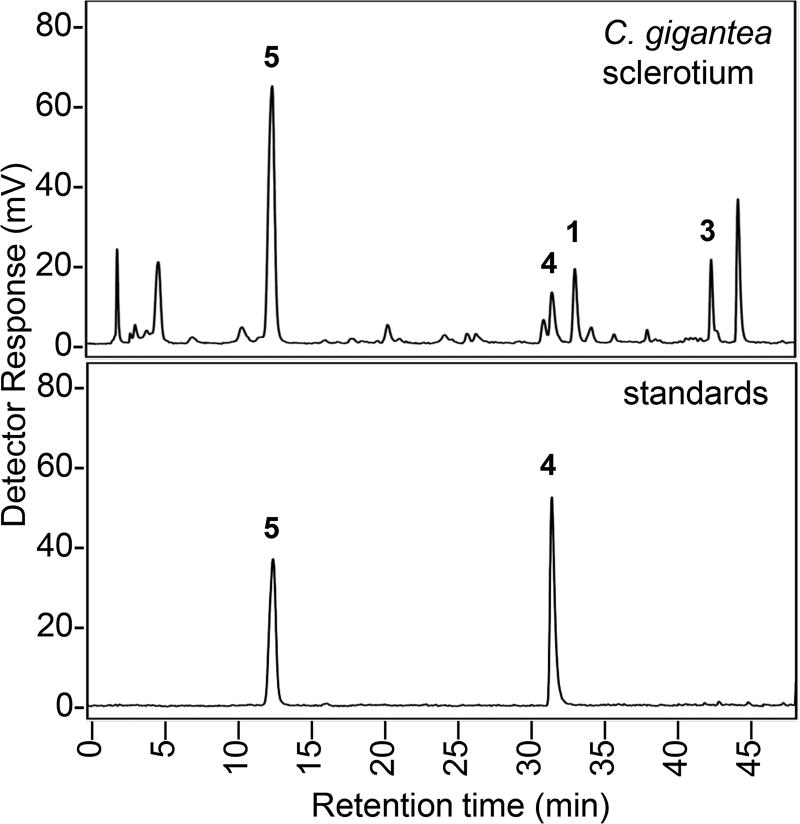
Figure 5.
HPLC analysis of a C. gigantea sclerotium. Analytes were detected by fluorescence with excitation and emission wavelengths of 272 and 372 nm, respectively. Peaks corresponding to characterized ergot alkaloids are indicated: 1, chanoclavine-I; 3, festuclavine; 4, dihydrolysergol; 5, dihydrolysergic acid.

