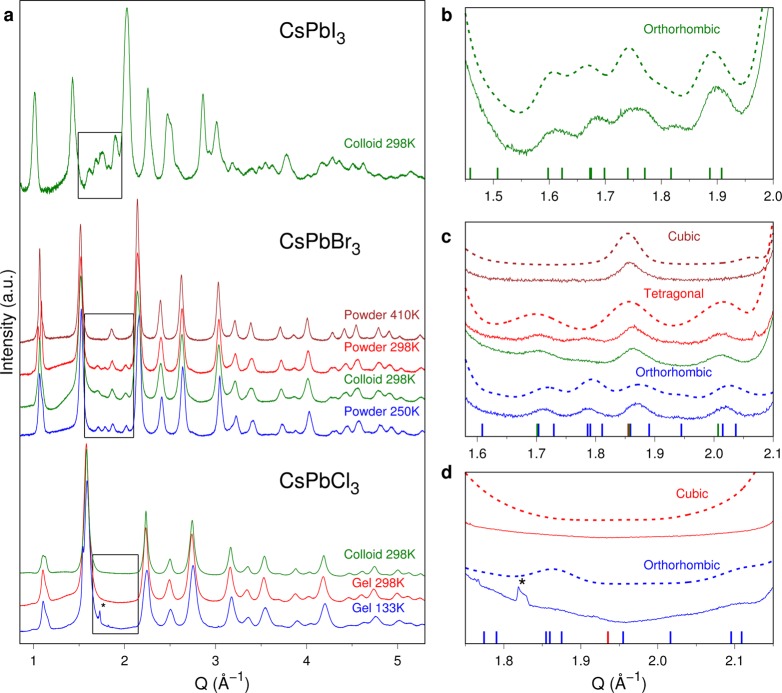
Figure 2.
(a) X-ray synchrotron total scattering data showing changes of superstructure peaks in CsPbX3 NCs at RT and upon phase transitions; simulations (dashed lines) vs experimental traces (solid lines) in the 1.5–2.2 Å–1Q range for (b) CsPbI3, (c) CsPbBr3, and (d) CsPbCl3. The starred (narrow) peak in panels (a) and (d) corresponds to the 101 reflection of contaminant ice (Ih phase).

