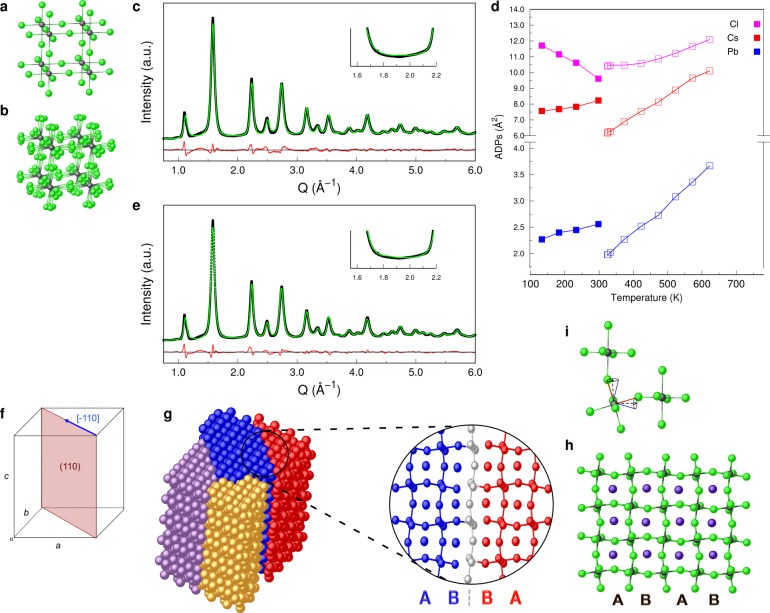
Figure 3.
(a) Cubic and (b) cubic-split model for CsPbCl3. (c) DSE best fit of RT X-ray synchrotron data (λ = 0.565468 Å) corresponding to the cubic-split model. The 1.8–2.2 Å–1Q region (inset) matches the cubic phase diffraction features. (d) ADPs behavior of Cl, Cs and Pb ions vs temperature as provided by Rietveld analysis (filled squares) in the 133–298 K range on NCs and by neutron diffraction (empty squares) on single crystal in the 325–623 K range from Sakata et al.55 The discontinuity near 320 K is explained by markedly different experimental conditions and methods of analysis. (e) DSE best fit corresponding to orthorhombic coherent subdomains; the 1.8–2.2 Å–1Q region (inset) well matches the cubic phase diffraction features: (f) schematic representation of a single 1/2[−110](110) twin boundary; (g) atomistic representation of nanotwins within a NC; the twin boundary highlighted in the circle shows the discontinuity of the halides lattice and the coherence of the Pb sublattice; (h) 2D projections of the undistorted orthorhombic structure; and (i) sketch of the cooperative rotations of PbCl6 octahedra at the twin boundaries as a viable mechanism of the dynamically changing twins network.

