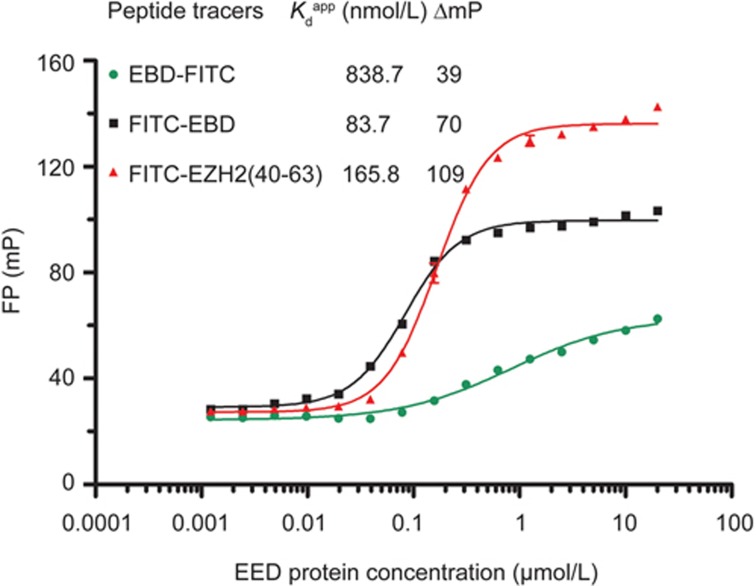
Figure 1.
The optimization of the peptide tracer. Fluorescence polarization (FP) saturation binding curves of three different FITC-labeled peptide tracers (20 nmol/L) incubated with serial dilutions of EED (0.001 to 20 μmol/L) in HEPES buffer at room temperature. The FP values were recorded at 2 h. The experiments were repeated three times, and the data were analyzed in GraphPad Prism 5.0.

