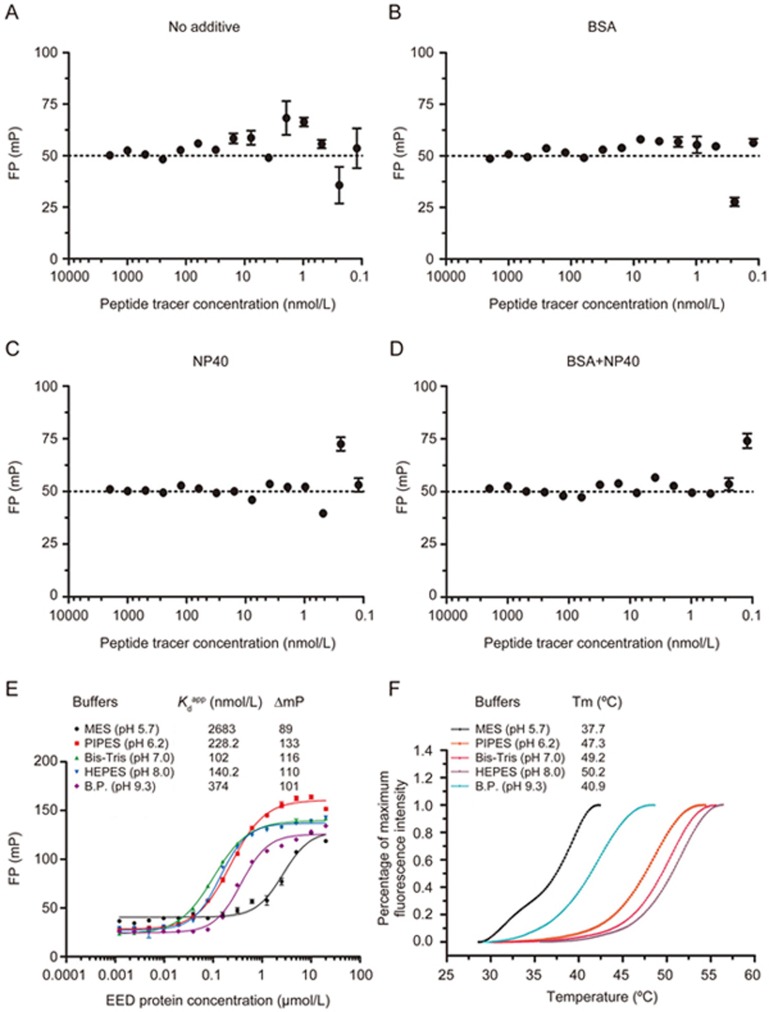
Figure 2.
FP buffer and pH optimization. The FP values of FITC-EZH2(40-63) are plotted as a function of the peptide tracer concentrations in HEPES buffer in the absence of additives (A) and in the presence of 0.1 mg/mL BSA (B), 0.01% NP40 (C), or both 0.1 mg/mL BSA and 0.01% NP40 (D). (E) FP saturation binding curves of FITC-EZH2(40-63) with different concentrations of EED in five different buffers. B.P. represents Bis-tris propane. The FP values were measured at 2 h. Three separate experiments were performed, and the data were analyzed in GraphPad Prism 5.0. (F) The melting curves of EED in five different buffers. In each well of 96-well assay plates, 2 μmol/L EED and 5× SYPRO Orange (Invitrogen) were mixed in 20 μL of 25 mmol/L buffers and 150 mmol/L NaCl. The assay plate was heated from 25 °C to 95 °C at a ramp rate of 0.05 °C/s. The changes in the fluorescence intensities of SYPRO Orange were monitored as a function of temperature. The melting temperature (Tm) was calculated with the Boltzmann fitting method in the Protein Thermal Shift Software v1.2. The experiments were performed in triplicate and independently repeated three times.

