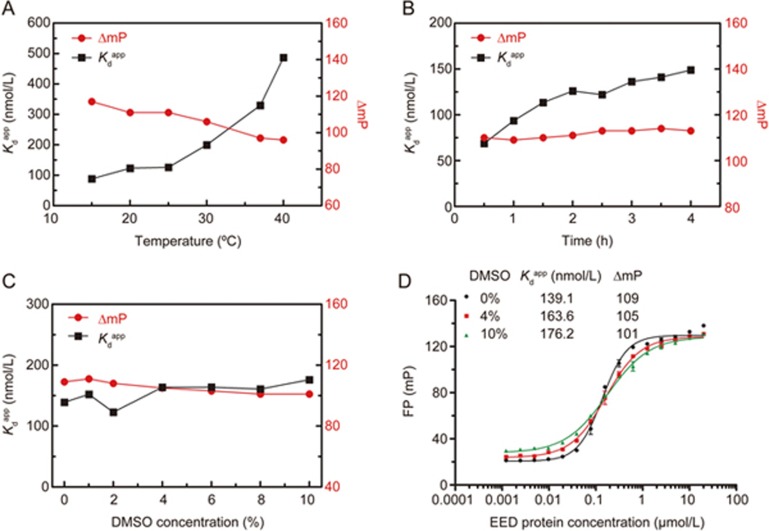
Figure 3.
Stability of the FP binding assay. Three separate experiments were performed, and the data were analyzed in GraphPad Prism 5.0. (A) The effect of incubation temperature on binding affinity and dynamic range. FP values were recorded at 2 h. (B) The time courses of binding affinity and dynamic range at room temperature (25 °C). (C) DMSO tolerance of the FP binding affinity and dynamic range. (D) FP saturation binding curves of FITC-EZH2 (40–63) with increasing concentrations of EED in the absence or presence of 4% and 10% DMSO. Three separate experiments were performed, and the data were analyzed in GraphPad Prism 5.0.

