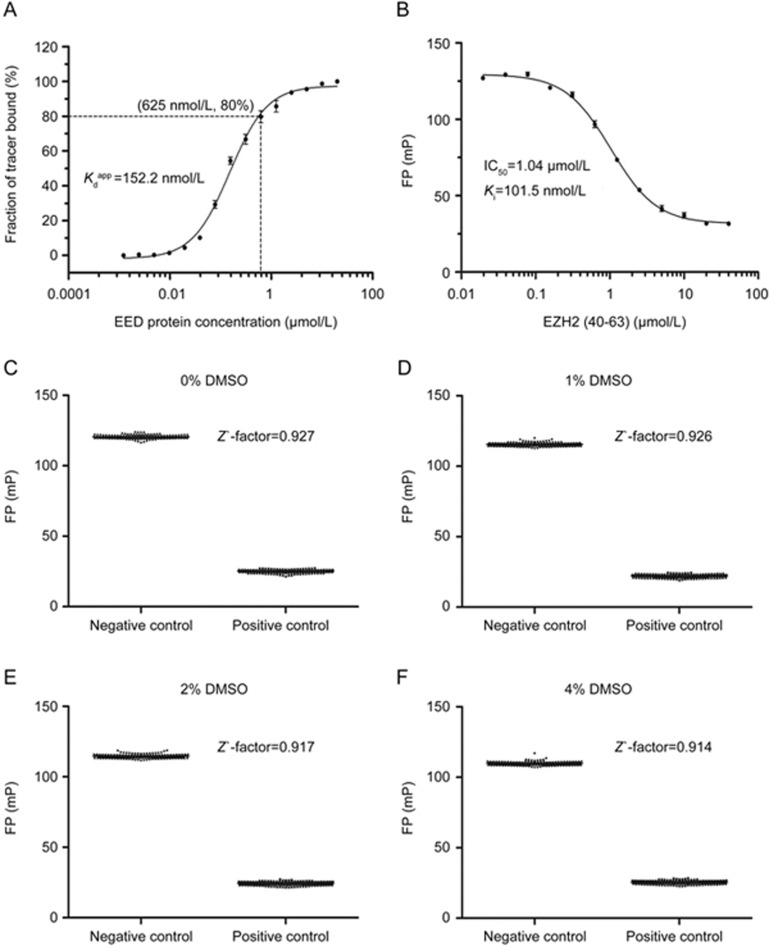
Figure 4.
FP competitive binding assay and determination of the Z' factors. (A) Selection of the EED concentration for the FP competitive binding assay based on the FP saturation binding curve at 80% fractions of tracer bound. (B) FP competitive binding curve. Mixtures of 20 nmol/L FITC-EZH2(40-63) and 625 nmol/L EED were incubated in the presence of different concentrations of unlabeled peptide EZH2(40-63) (20 nmol/L to 40 μmol/L). The FP values were recorded at 2 h. (C–F) Z' factors for evaluation of the FP-based high-throughput screening assay in the absence or presence of 1%, 2%, and 4% DMSO. The FP values of both negative and positive controls are shown in a scatter plot. All experiments were performed at least three times. The data were analyzed in GraphPad Prism 5.0.

