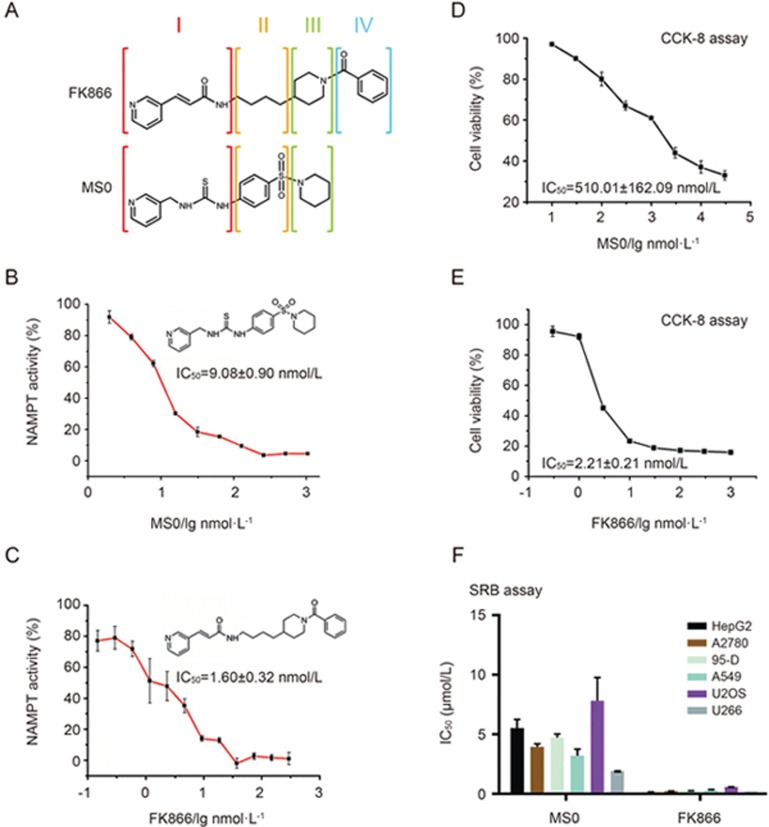
Figure 1.
Activity and structure differences between MS0 and FK866. (A) Structural differences between MS0 and FK866. (B) Inhibitory potency (IC50) of MS0 on NAMPT activity. (C) Inhibitory potency (IC50) of FK866 on NAMPT activity. (D) Concentration response curve of MS0 on HepG2 cells after 48 h of treatment. (E) Concentration response curve of FK866 on HepG2 cells after 48 h of treatment. (F) IC50 of MS0 and FK866 inhibition on various human cancer cell lines (SRB assay after 72 h of treatment). Data are expressed as the mean±SEM.

