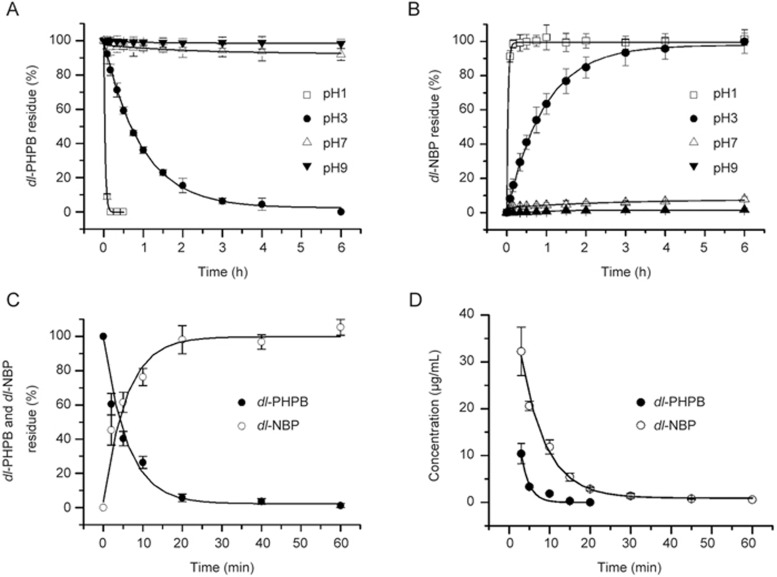
Figure 2.
Time profile of dl-PHPB conversion. Time profiles of dl-PHPB and dl-NBP concentration in different pH solutions (A: dl-PHPB, B: dl-NBP) and SD rat plasma (C) were obtained after incubation at a final concentration of 10 μg/mL for different times at 37 °C (each point represents the mean±standard error of triplicate determinations). In vivo conversion (D), the mean plasma concentration versus time profiles of dl-PHPB and dl-NBP were obtained after the intravenous administration of dl-PHPB (20 mg/kg) in SD rats (n=6, 3/sex). Each point represents the mean±SD.

