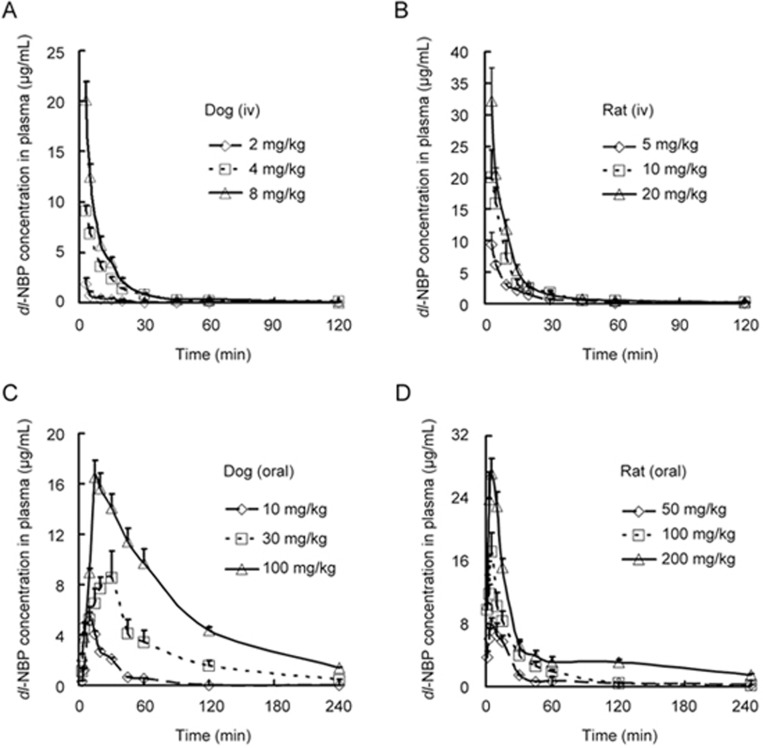
Figure 5.
Mean plasma concentration versus time profiles of dl-NBP after the administration of dl-PHPB. Dl-PHPB was intravenously administered in Beagle dogs (A: 2, 4, and 8 mg/kg) and SD rats (B: 5, 10, and 20 mg/kg); and orally administered in Beagle dogs (C: 10, 30, and 100 mg/kg) and SD rats (D: 50, 100, and 200 mg/kg). Blood samples were obtained at 0, 1, 3, 5, 10, 15, 20, 30, 45, 60, 120, and 240 min after administration. Values are the mean±standard deviation (n=6, 3/sex).

