
Figure 1.
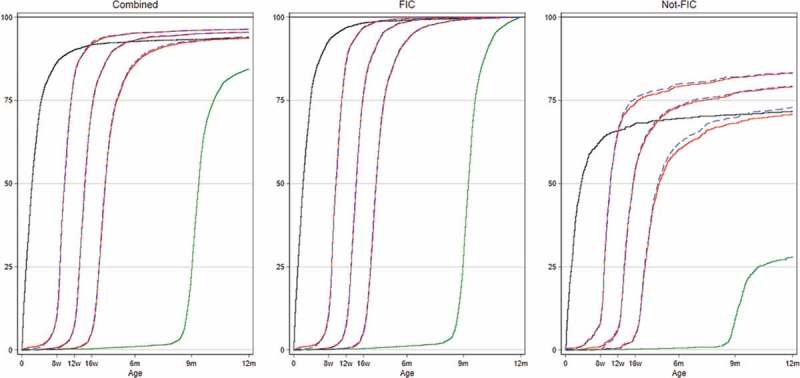
Vaccination coverage curves for children in Nouna HDSS 2012–2014 overall and subdivided by children who were fully immunized (FIC) and not FIC. Kaplan–Meier survival curves indicate vaccination coverage at specific ages. Black line: BCG vaccination; red lines: vaccination with pentavalent vaccines; blue lines: oral polio vaccine and green lines: measles vaccine.