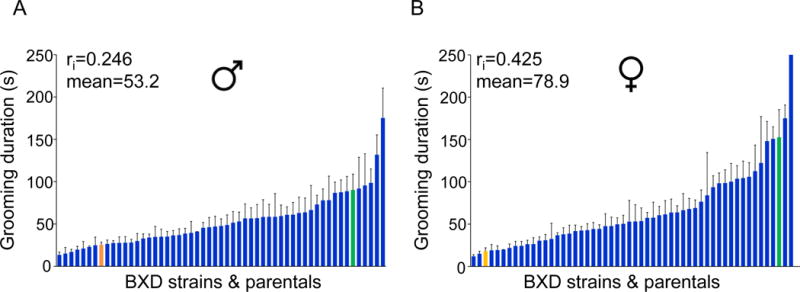
Figure 1. BXD strain differences for grooming duration in the open field.

Variation in grooming duration time in the BXD mice and parental strains. C57BL/6J orange bars and DBA/2J green bars; Males (A) and females (B). Bar graphs represent the means (+/-SEM). Intra-class correlations and overall means are shown. The y-axis represents grooming duration time in seconds with BXD strains rank ordered from low to high. For enlarged versions indicating strain names, see Figures S1 A and B.
