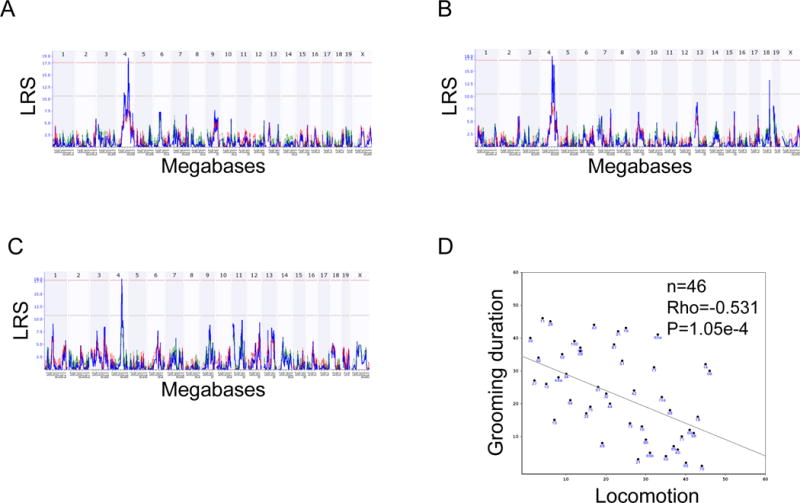
Figure 2. Whole genome scans of trait data for grooming duration and locomotion.

A-C: Whole genome scans for grooming duration (A: males, B: females) and locomotion (C: females). The x-axis represents chromosome number and megabase position (tick marks represent 25 Mb increments, each chromosome starting at 0) and the y-axis represents the likelihood ratio statistic (LRS) of linkage. Blue lines represent LRS across the genome. The pink and gray horizontal lines are approximate threshold values which are used to assess whether a peak is significant (P<0.05) or suggestive (P<0.63) respectively. D: Spearman rank correlation plot for grooming duration and locomotion. For enlarged versions, see Figures S2 A–D.
