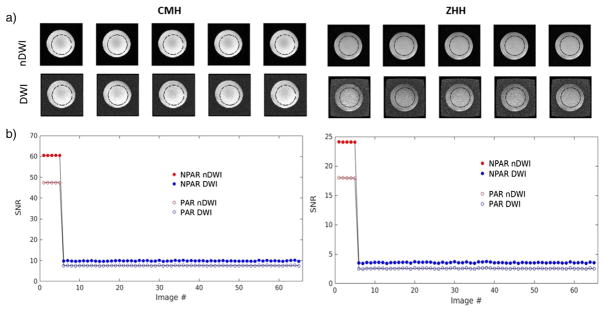
Fig. 5.
SNR results. Sample images are shown along with SNR plots across nDWIs and DWIs, for two sites. Plots show NPAR and PAR results overlaid for comparison. The images in a) show sample images (nDWI and DWIs) for the NPAR case with the position of the ccROI used to compute average signal for SNR computations; this ROI enables the exclusion of edge effects. The increased stability of SNRDWI and overall decrease in SNR with PAR is apparent in the plots in b).

