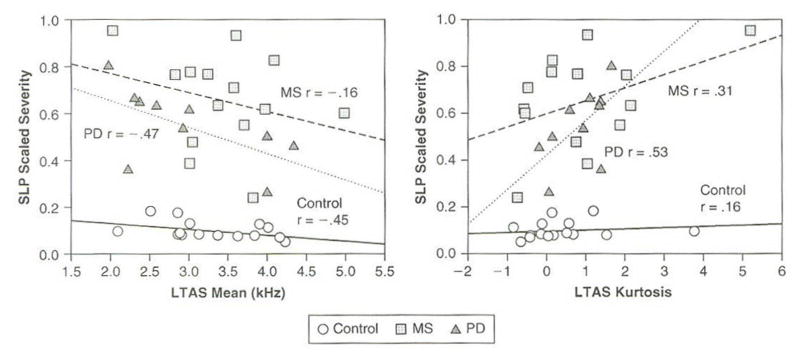
Figure 3.
Scatterplots Relating Select Moment Coefficients of the LTAS and Scaled Severity are Shown. Group Affiliation in Each Panel is Indicated by Symbol Shape. Partial Correlation Coefficients in the Form of R Values also are Shown in Each Plot. Simple Regression Lines have been Fit to Each Speaker Group’s Data to Illustrate the Relationship Between Acoustic and Perceptual Measures

