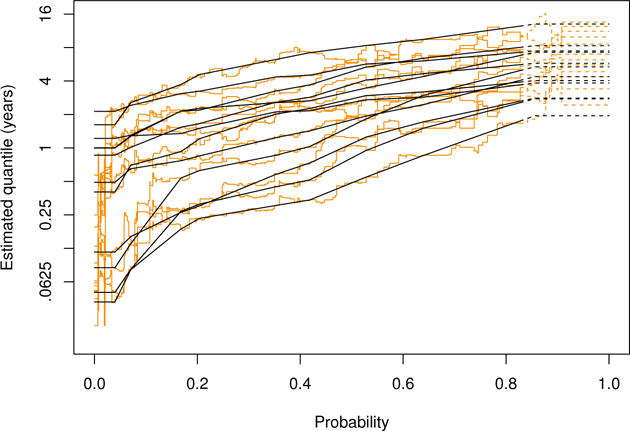
Figure 3.

Estimated conditional quantile functions from the Mayo primary biliary cirrhosis study. The original estimates, in light, and those from the adaptive interpolation method, in dark, are shown for 12 covariate values as chosen from the 102 vertices of . Portions of these estimators beyond the identifiability bound surrogate, 0.828, are denoted with dashed lines.
