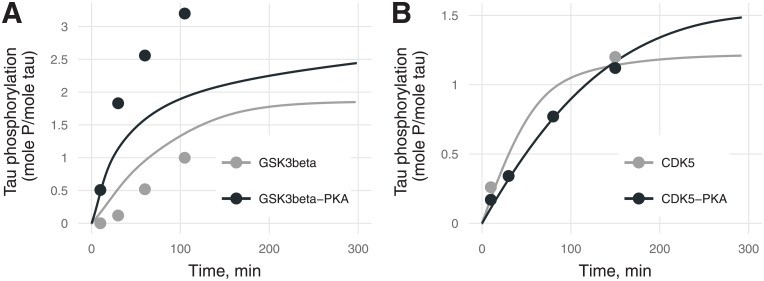
Fig 3. Phosphorylation stoichiometry (the ratio of phosphorylated tau to total tau, mol P/mol) for (A) GSK3β and (B) CDK5 with unphosphorylated tau (gray) or PKA-prephosphorylated tau (black) [20].
Experimental values are marked by points, and model predictions by lines. Two black and gray experimental points for CDK5 (B) coincide. Errors of experimental values were not provided by the authors [20].

