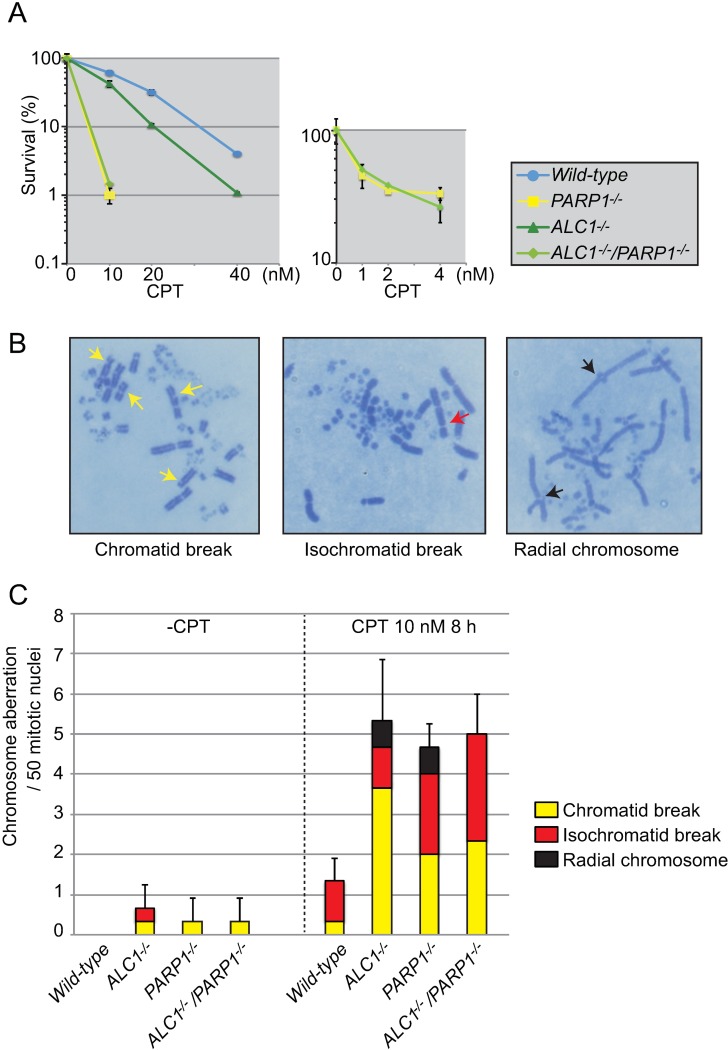
Fig 2. Epistatic relationship between ALC1-/- and PARP1-/- in cellular tolerance to CPT.
(A) Cells with indicated genotypes were assessed for CPT sensitivity as in Fig 1. Dose is displayed on the x-axis, while the cell-survival percentage is displayed on y-axis. Error bars represent standard deviations from three independent experiments. The data for wild-type, ALC1-/- and PARP1-/- were same with the data in Fig 1. (B) Representative images showing DT40 chromosomes. Chromosomes from wild-type DT40 cells treated with mitomycinC were analyzed as described in Materials and Methods. The yellow, red and black arrows indicate chromatid breaks, isochromatid breaks and radial chromosomes, respectively. (C) Number of chromatid breaks, isochromatid breaks, and radial chromosomes in 50 mitotic cells. Chicken DT40 cells were exposed to CPT (10 nM) for 8 h with colcemid added 2.5 h before harvest to accumulate mitotic cells. Error bars represent standard deviations from three independent experiments.

