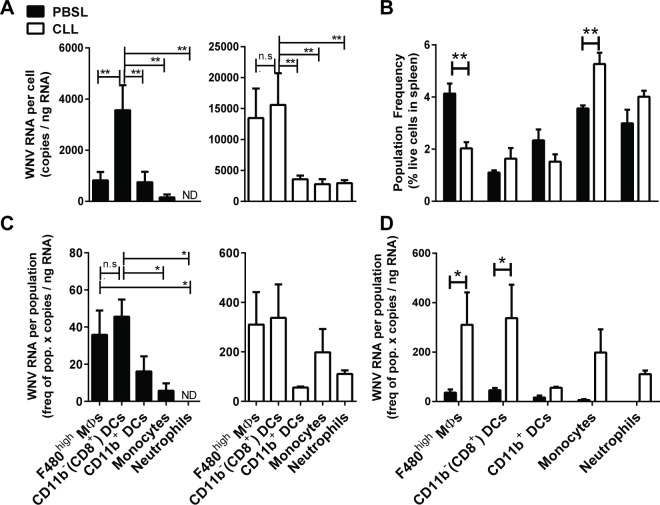
Fig 6. Quantification of WNV viral RNA in myeloid cells from WNV infected mice.
Mice were treated with CLL (open bars) or PBSL (black bars) 3 days prior to footpad inoculation with WNV (1000 PFU); spleens were harvested at day 3–4 p.i., and splenocytes were enriched using magnetic beads for CD11b-, CD11c-, or F4/80hi cells (see Methods). Purified myeloid populations were obtained by cell sorting and RNA isolated for quantization via qPCR. (A) WNV quantities/cell indicate that in infected PBSL control mice CD11b- DCs had significantly higher WNV RNA levels than other myeloid subsets. 1-way ANOVA (B) Population frequency determined by FACS analysis on total spleen single cell preparations. 2-way ANOVA with Bonferroni post-test (C) WNV quantity per population indicates that splenic F4/80hi MΦs and CD11b- DCs had similar levels of WNV, while CD11b+ DCs and MOs had much less. 1-way ANOVA. (D) CD11b- DCs and repopulating F4/80hi MΦs had significantly higher WNV RNA levels per population in CLL treated mice vs. control mice. 2-way ANOVA with Bonferroni post test. Data represent the combined data from 3 independent experiments. * p < 0.05, ** p <0.01.

