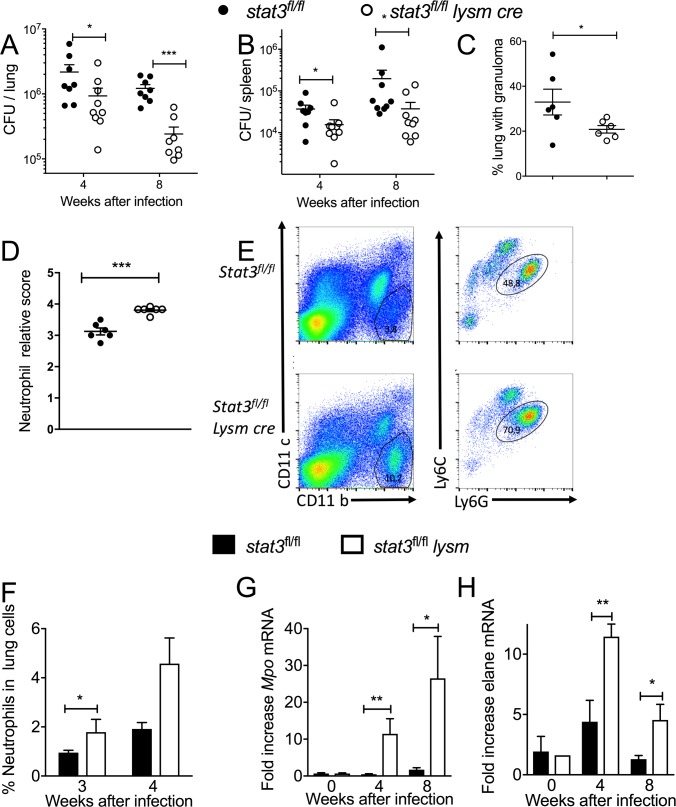
Fig 1. Stat3fl/fl lysm cre mice are resistant to infection with M. tuberculosis.
Stat3fl/fl lysm cre and stat3fl/fl littermate controls were sacrificed at indicated time points after aerosol infection with M. tuberculosis and colony forming units (CFU) per lung (A) and spleen (B) were assessed. The CFU per organ of individual mice and the median per group at the indicated time points after infection are depicted. For each time point 8–10 control and 8–10 mutant mice were infected simultaneously. We performed separated experiments for 4 and 8 weeks post infection. Only one representative of the two experiments for 4 as well as 8 weeks post infection is depicted. Differences in CFU are significant (*p<0.05, **p<0.01, ***p<0.001 Mann Whitney U test). Histopathological scoring of hematoxylin-eosin stained paraffin lung sections from stat3fl/fl lysm cre and stat3fl/fl mice measured 4 and 8 weeks after infection with M. tuberculosis. The mean ± SEM % lung area with granulomas (C) and the relative neutrophil density score (D) are depicted. Differences are significant (*p<0.05, ***p<0.001 Student t test). A representative dot plot (E) and the frequency (F) of CD11b+CD11c-Ly6Cdim Ly6G+ neutrophils in lungs stat3fl/fl lysm cre and stat3fl/fl mice 3 and 4 weeks after infection with M. tuberculosis are shown. Differences between 4 mice at each time point are significant (*p<0.05 Student’s t test). Total RNA was extracted from the lungs of stat3fl/fl lysm cre and stat3fl/fl mice at the indicated time points after infection with M. tuberculosis. The relative concentration of neutrophil elastase (elane) (G) and myeloperoxidase (mpo) transcripts (H) in relation to hprt mRNA levels in the same sample was determined by real time PCR. The mean fold induction of these transcripts ± SEM is depicted. Differences with control mice are significant (*p<0.05, **p<0.01 Student t-test).

