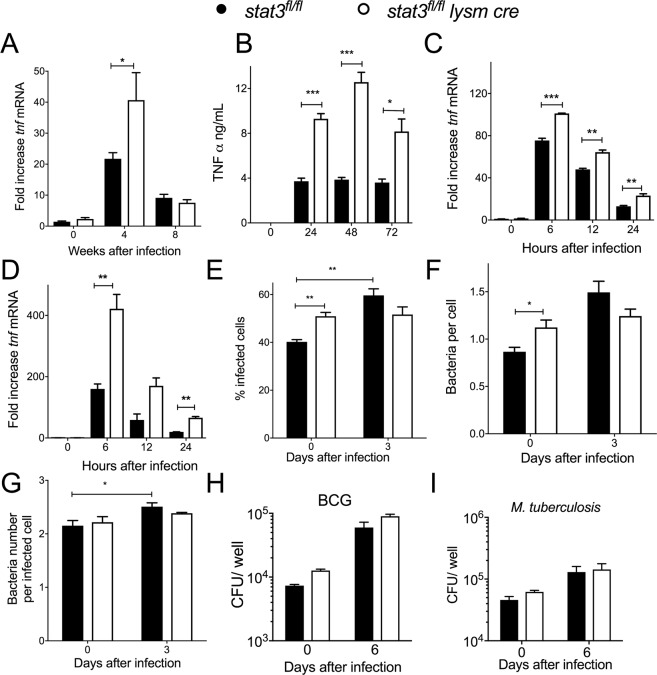
Fig 2. Stat3 deficient and control BMM show similar control of the intracellular growth of M. tuberculosis.
The levels of tnf mRNA in the lungs from stat3fl/fl lysm cre and stat3fl/fl mice at the indicated time points after infection with M. tuberculosis (A), and in stat3fl/fl lysm cre and stat3fl/fl BMM incubated with M. tuberculosis (C) or BCG (D) were determined by real time PCR. The mean fold increase of mRNA level ± SEM in 8 mice per group (A) or in triplicate independent cultures per condition compared to non-infected cultures (C, D) of one of two independent experiments is depicted (*p<0.05, **p<0.01, ***p<0.001 Student t test). The mean concentration of TNF in the supernatants of stat3fl/fl lysm cre and stat3fl/fl BMM at different times after M. tuberculosis infection were measured by ELISA (B). The mean % of infected BMM (E), the bacteria number per BMM (F) and the bacteria per infected BMM (G) ± SEM at 0 and 3 days after infection of stat3fl/fl lysm cre and stat3fl/fl BMM were determined after staining with auramin-rhodamin T for mycobacterial and DAPI for nuclei (E-G). One out of 2 independent experiments performed is depicted. Bacterial CFU were determined in stat3fl/fl lysm cre and stat3fl/fl BMM after infection with BCG (H) or M. tuberculosis (I) at a MOI of 5:1. The mean CFU ± SEM from triplicate cell cultures is shown. Three independent experiments for each panel were performed.

