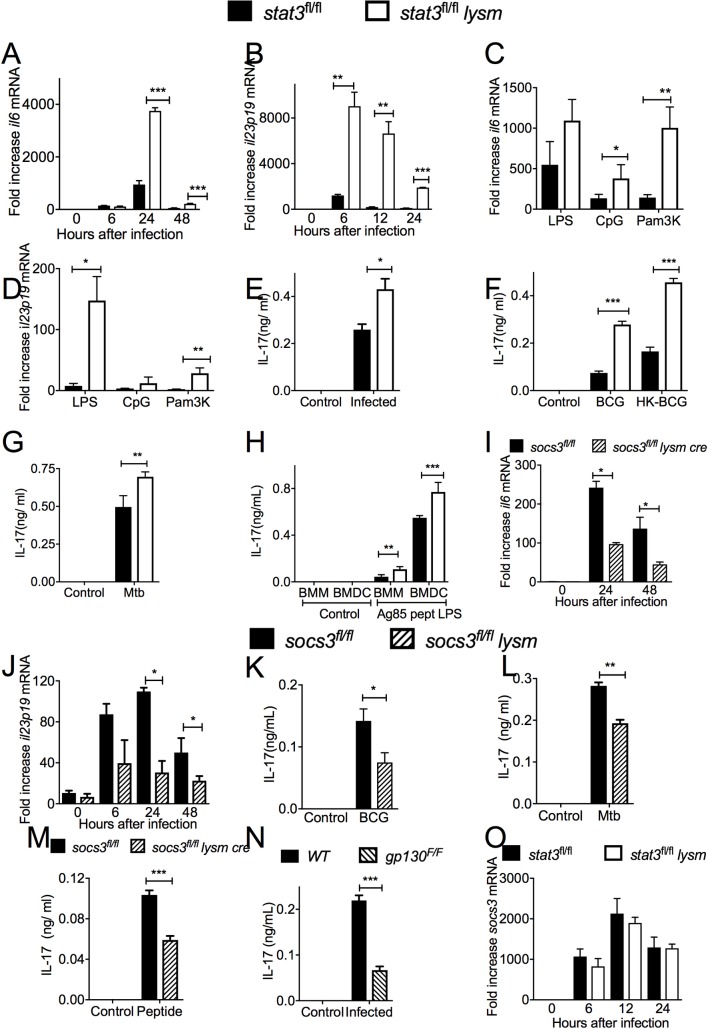
Fig 6. STAT3 and SOCS3 regulate the secretion of IL-17 by antigen-specific T cells.
Total RNA was extracted from stat3fl/fl lysm cre and stat3fl/fl BMDC cultures 24 h after M. tuberculosis infection. Il6 and il23p19 mRNA were measured by real time PCR and normalized to the hprt mRNA levels in the same samples. The mean and il6 (A) il-23p19 (B) mRNA fold increase ± SEM levels in triplicate independent cultures are depicted (*p<0.05, **p<0.01 and ***p<0.001 Student’s t test). The mean fold increase of il6 (C) and il23p19 (D) ± SEM were measured by real-time PCR in triplicate cultures of stat3fl/fl lysm cre and stat3fl/fl BMDCs 24 h after stimulation with either LPS, CpG or Pam3K (*p<0.05 and **p<0.01 Student’s t test). Stat3fl/fl lysm cre and stat3fl/fl BMDC (E-H) or BMM (H) were stimulated with either BCG (E), heat killed BCG (F), M. tuberculosis (G), or with LPS and the peptide 25 of Ag85b (H) and incubated 6 h after with p25-tg CD4+ naïve T cells (at a ratio of 4:1 BMDC). The concentration of IL-17 in the culture supernatants was measured by ELISA 72h after co-incubation. The mean IL-17 ng/ ml ± SEM from triplicate cultures is depicted (* p<0.05; **p<0.01 and ***p<0.001 Student’s t test). Total RNA was extracted from socs3fl/fl lysm cre and socs3fl/fl BMDC cultures at different times after infection with mycobacteria. The mean Il6 (I) and IL23p19 (J) mRNA levels ± SEM levels determined by real time PCR are depicted (**p<0.01 Student’s t test). The concentration of IL-17 was measured 72h supernatants of co cultures of p25-tg naïve T cells incubated with either BCG (K), M. tuberculosis (L) or pept25 and LPS (M)-stimulated socs3fl/fl lysm cre and socs3fl/fl BMDCs. The mean IL-17 ng/ ml ± SEM from triplicate independent cultures were determined by ELISA (*p<0.05; **p<0.01 and ***p<0.001 Student’s t test). IL-17 was measured in 72 h culture supernatants from control or BCG-infected gp130F/F BMDC and p25-tg T cells. The mean IL-17 ng/ ml ± SEM from triplicate cultures from infected or control BMDCs is shown in (N). Differences are significant at ***p<0.001 Student’s t test. The mean fold increase of socs3 transcript ± SEM in total RNA from stat3fl/fl lysm cre and stat3fl/fl BMDC at different time points after M. tuberculosis infection as compared to uninfected controls were measured by real time PCR are depicted (O).

