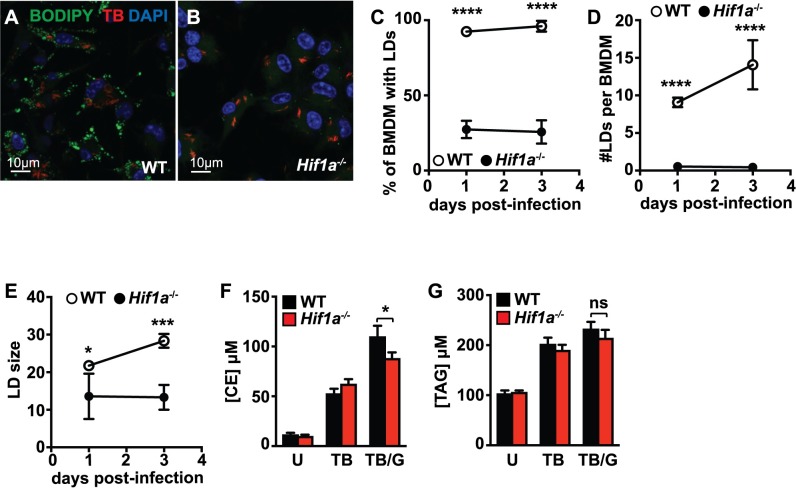
Fig 4. HIF-1α is required for LD formation during M. tuberculosis infection.
(A) Wildtype and (B) Hif1a-/- BMDMs were infected with M. tuberculosis 635-Turbo following IFN-γ activation. 1 day post-infection, BMDM were stained with BODIPY 493/503 and confocal microscopy was performed. CellProfiler was used to quantify (C) the percentage of BMDM with LDs, (D) the number of LDs per BMDM, and (E) LD size 1 and 3 days post-infection. Each data point is quantified from ~500 BMDM. (F,G) Lipidomic quantification of (F) total cellular cholesterol ester [CE] and (G) total triacylglycerol [TAG] concentrations in wildtype and Hif1a-/- BMDM was performed by Metabolon, Inc using mass spectrometric analysis of quintuplicate samples. BMDM were infected with M. tuberculosis and cell lysates were prepared 1 day post-infection. BMDM were either uninfected [U], M. tuberculosis infected [TB], or IFN-γ activated and M. tuberculosis infected [TB/G]. (A-E) Figures are representative of a minimum of three experiments. (F,G) Lipidomic profiling was performed once in quintuplicate. Error bars are standard deviation, *p<0.05, ***p<0.001, ****p<0.0001 by unpaired t-test.

