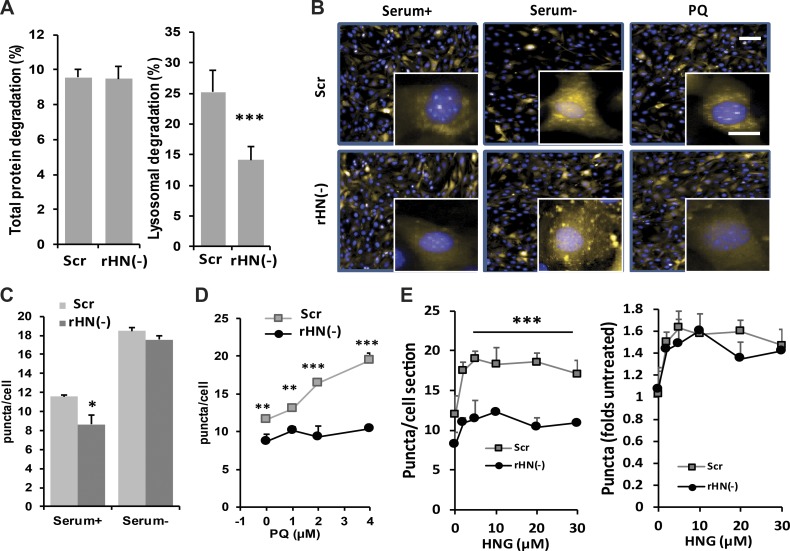
Figure 4.
Effect of rHN knockdown on CMA. (A) Analysis of total protein degradation (left) and lysosomal protein degradation (right) in NIH3T3 cells control or knocked down of endogenous rHN using siRNA rHN− cells. (B–E) Analysis of CMA activity in control and rHN− NIH3T3 cells stably expressing the KFERQ-PS-dendra CMA reporter maintained in serum-supplemented (+) or serum-depleted (−) media or in the presence of 5 mM PQ. (B) Representative images. Inserts show higher magnification. Bars: (main images) 50 µm; (insets) 10 µm. Nuclei are stained with DAPI. (C) Quantification of the number of puncta per cell in basal conditions and in response to serum removal. (D) Dose-dependence effect of the same cells exposed to increasing concentrations of PQ. (E) Dose-dependent effect of adding increasing concentrations of HNG to the same cells. Number of puncta per cell (left) and increase in number of puncta normalized to untreated conditions (right). All values are presented as means + SEM and come from the quantification of nine different fields (∼3,500 cells total per condition) in triplicate wells. Differences between rHN− and control were significant for *, P < 0.05; **, P < 0.01; ***, P < 0.001.

