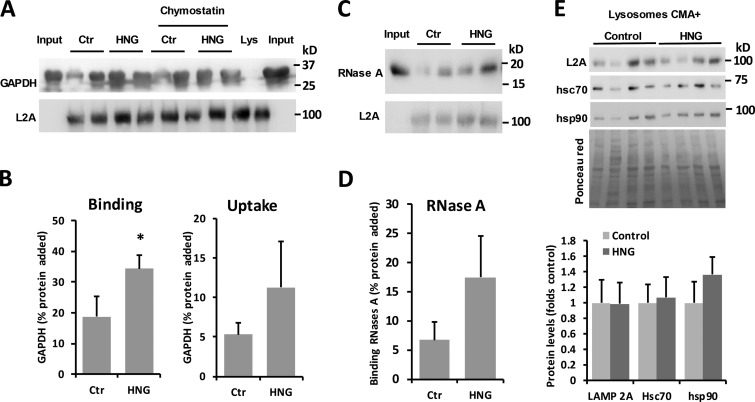
Figure 6.
Effect of in vivo treatment with HNG on hepatic CMA. (A–D) CMA activity in the liver from rats treated with 2 mg/kg of HNG or SP for 6 h. Immunoblots for LAMP-2A (A and C) and GAPDH (A) or RNase A (C) in lysosomes isolated from livers of untreated (control; Ctr) or HNG-treated rats and incubated with the two different substrates. Quantification of the binding (B and D) and uptake (B) of the substrates in n = 4 (B) or n = 2 (D) animals. (E) Immunoblots for the indicated proteins in CMA-active lysosomes isolated from the same animals as in A. Bottom shows quantification of the levels of the indicated proteins in HNG-treated animals relative to those in control untreated. n = 4. All values are means + SEM. Differences with untreated animals were significant for *, P < 0.05.

