Figure 1.
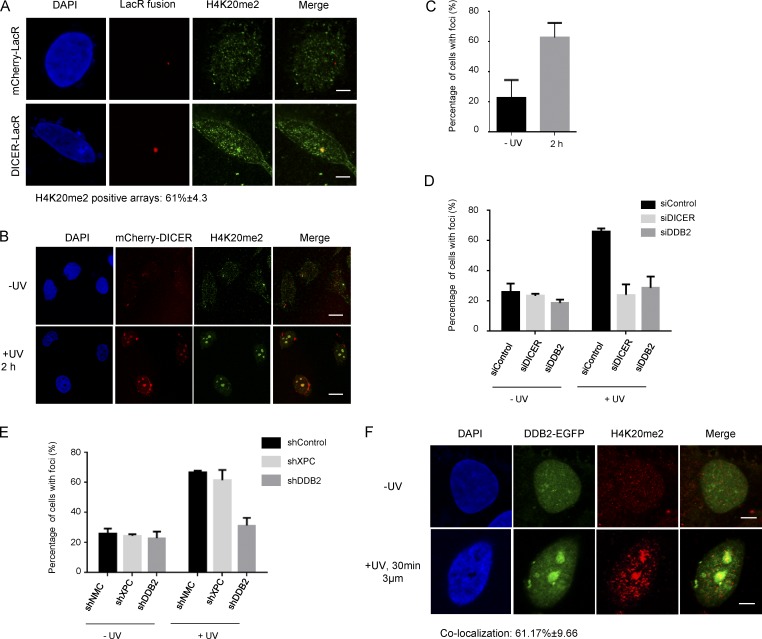
UV exposure results in formation of H4K20me2 foci. (A) DICER leads to H4K20me2 at foci. Immunofluorescence images showing distribution of H4K20me2 in 2–6-3 cells, containing a chromatin array tethered with either mCherry-LacR (Control) or mCherry-LacR-DICER. H4K20me2 is observed at ≈61% of DICER-LacR arrays and 0% of mCherry-LacR arrays. Bars, 5 µm. (B) UV exposure results in colocalization of H4K20me2 with DICER foci. Immunofluorescence images showing nuclear distribution of H4K20me2 in UV unexposed and UV exposed U2OS cells expressing mCherry-DICER. Bars, 25 µm. (C) The graph shows the percentage of U2OS cells showing foci of H4K20me2 overlapping with DICER in unexposed cells and after UV exposure (mean ± SEM). Cells were counted from three independent experiments, with 200 cells counted per experiment. (D and E) Formation of H4K20me2 foci is dependent on NER. The graph shows the percentage of cells showing foci of H4K20me2 in unexposed U2OS cells (−UV) and 2 h after UV exposure (+UV) in the indicated knockdown cell lines (mean ± SEM). Cells were counted from three independent experiments, with 200 cells counted per experiment. (F) H4K20me2 is observed at the site of UV damage. Immunofluorescence images showing distribution of DDB2-EGFP and H4K20me2 in U2OS cells unexposed to UV and subjected to damage through a 3-µm micropore membrane. The damage sites are marked by DDB2-EGFP. H4K20me2 is observed at ≈61% of lesions 30 min after UV exposure. Bars, 5 µm.

