Figure 4.
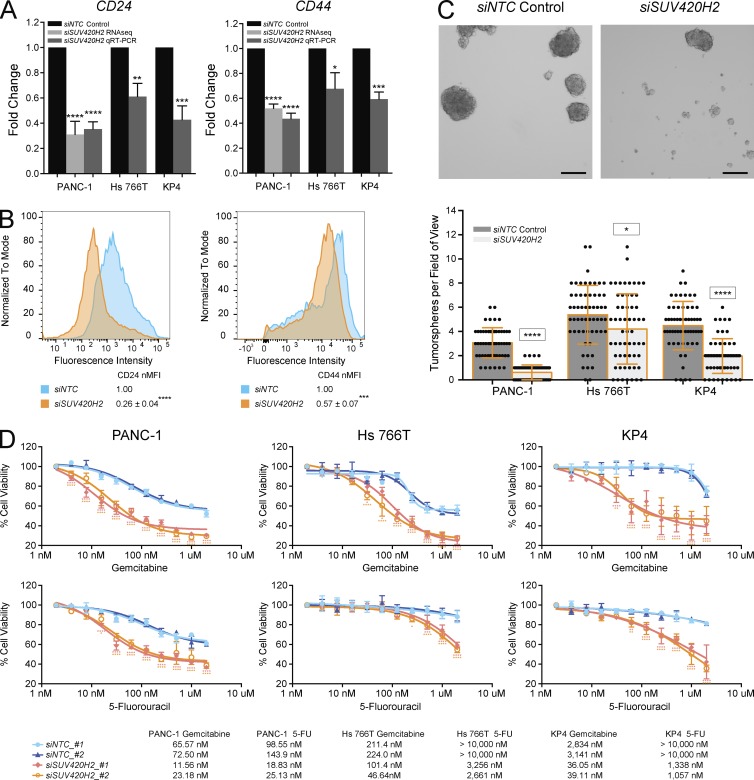
SUV420H2 knockdown decreases stemness and anticancer drug resistance of mesenchymal pancreatic cancer cells. (A) CD24 and CD44 RNA expression levels with NTC control or SUV420H2 knockdown determined by RNaseq or qRT-PCR. For graphs, bars indicate mean ± SD. For RNaseq, n = 3 biological replicates and differences assessed by using voom+limma (see Materials and methods). For qRT-PCR, n = 3 biological replicates each averaged from three technical replicates, and differences were assessed by Student’s t test compared with siNTC control. *, P < 0.05; **, P < 0.01; ***, P < 0.001; ****, P < 0.0001. (B) Cell-surface protein level for CD24 and CD44 analyzed by flow cytometry in PANC-1 cells. B shows one representative panel per condition of a set of triplicates; differences were assessed by Student’s t test compared with siNTC control. ***, P < 0.001; ****, P < 0.0001. (C) Tumorsphere formation assay showing representative images from a PANC-1 experiment and quantitation in three pancreatic cancer cell lines. n = 60 fields of view considered for each cell line, composed of 20 across three biological triplicates. Bar graphs depict mean ± SD. Differences were assessed by Student’s t test compared with siNTC control in each cell line. *, P < 0.05; ****, P < 0.0001. Bars, 250 µm. (D) Cell viability assays demonstrating effects of Gemcitabine and 5-Fluorouracil (5-FU) over 72 h on mesenchymal pancreatic cancer cells with NTC control or SUV420H2 knockdown, with two siRNAs for each. n = 6 biological replicates. Significance for each drug concentration was assessed by two-way analysis of variance compared with siNTC_#1 control and indicated as pink and orange asterisks for siSUV420H2_#1 and siSUV420H2_#2, respectively. IC50 for each condition is displayed in the table. *, P < 0.05; **, P < 0.01; ***, P < 0.001; ****, P < 0.0001.

