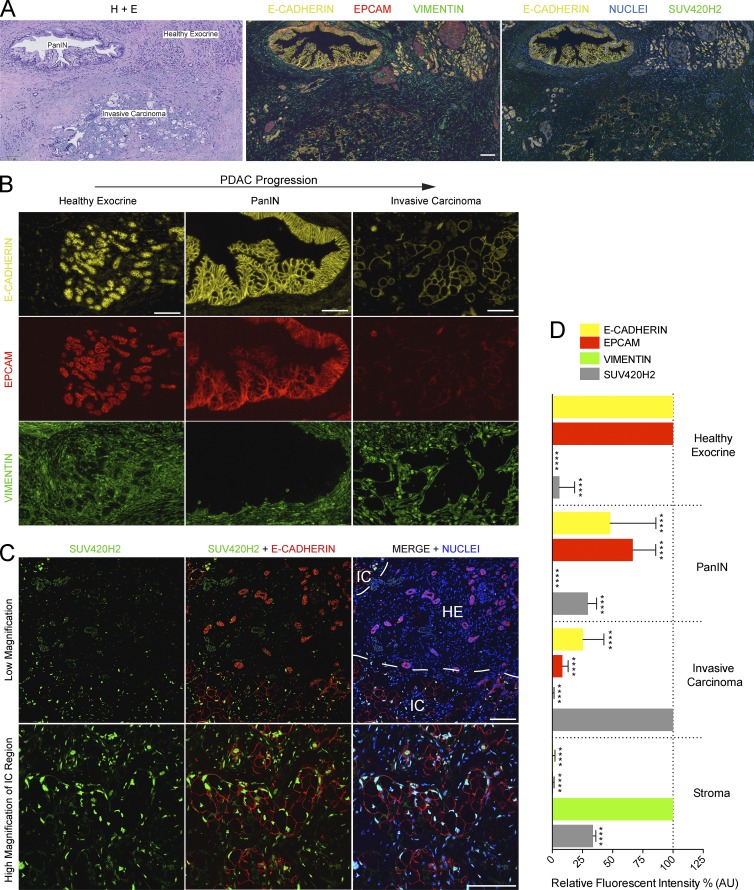
Figure 7.
Epithelial/mesenchymal markers and SUV420H2 in human PDAC. (A) Serial sections through a human PDAC sample with a healthy exocrine epithelium, early, or invasive cancer region. One section was exposed to hematoxylin and eosin (H+E) stain and two sections with immunofluorescence for different markers. Bar, 100 µm. (B) Immunofluorescence for E-CAD, EPCAM, and VIM in different stages of PDAC progression. Bars, 100 µm. (C) Immunofluorescence for SUV420H2 and E-CAD in a section of human PDAC. Low-magnification images show a region with healthy exocrine displaying pancreatic acini (strong E-CAD signal, low SUV420H2 signal) and an invasive cancer region with dysplastic malignant cells (low E-CAD stain in cancer cells, strong SUV420H2 signal). High-magnification images show dysplastic cells with low E-CAD stain show a strong nuclear SUV420H2 signal. Bars, 100 µm. (D) Quantitation of fluorescent signal for E-CAD, EPCAM, VIM, and SUV420H2 in progressive stages of PDAC (see Fig. S4 for more sample images). n = 8 PDAC samples from separate patients, analysis of one healthy exocrine region, one PanIN, and one invasive carcinoma region in each; signal was quantified in 16 cells per region for a total of 128 measurements per marker, per stage. Measurements for 128 stromal cells in total collected evenly from all images. Data were normalized to the stage/tissue with strongest signal for each marker analyzed. Bar graphs depict mean ± SD. Differences were assessed by Student’s t test compared with normalizer. ****, P < 0.0001. IC, invasive carcinoma; HE, residual exocrine.

