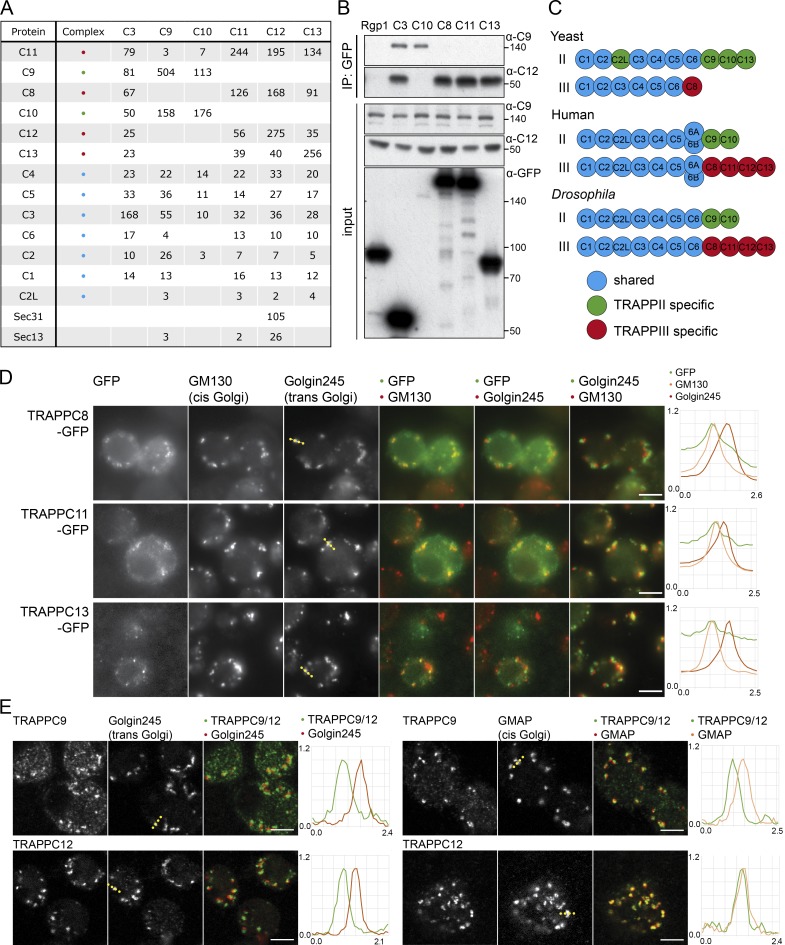
Figure 2.
The TRAPP complexes of Drosophila. (A) Mass spectrometry analysis of TRAPPC3, TRAPPC9, TRAPPC10, TRAPPC11, TRAPPC12, and TRAPPC13 tandem affinity purified from stably transfected cell lines. Total spectral counts for each protein are shown, with replicates shown in Fig. S1 B. Precipitations also contained lower levels of abundant chaperones and cytosolic enzymes. With the shared TRAPP subunit TRAPPC3, only three proteins apart from known TRAPP subunits were consistently present across all TAP purifications and several single-step purifications (catalase, ribosomal protein S26, and Gdi), and these were only present at trace levels in the TAP samples and so were not pursued further. (B) Immunoblot using the TRAPPC9 and TRAPPC12 antibodies of proteins associated with Rgp1, TRAPPC3, TRAPPC8, TRAPPC10, TRAPPC11, and TRAPPC13 after anti-GFP affinity purification from lysates of transiently transfected S2 cells. Molecular masses are given in kilodaltons. IP, immunoprecipitation. (C) Subunits present in the different the TRAPP complexes of yeast, flies, and humans. (D) Widefield micrographs of S2 cells transiently expressing GFP-tagged TRAPPC8, TRAPPC11, and TRAPPC13 and stained with antibodies against Golgin245 and GM130. Line scans of fluorescence intensity relative to the maximum are from representative Golgi stacks (dotted line on Golgin245 panels). The TRAPP subunits are enriched at the cis end of the stack. (E) Confocal micrographs of S2 cells labeled with antisera to endogenous TRAPPC9 (TRAPPII) or TRAPPC12 (TRAPPIII) and the Golgi proteins Golgin245 or GMAP. Line scans are from representative Golgi stacks (dotted line on Golgi marker panels). Bars, 5 µm. Images in D and E are representative of at least two independent experiments, with at least three micrographs obtained from each.

