Figure 4.
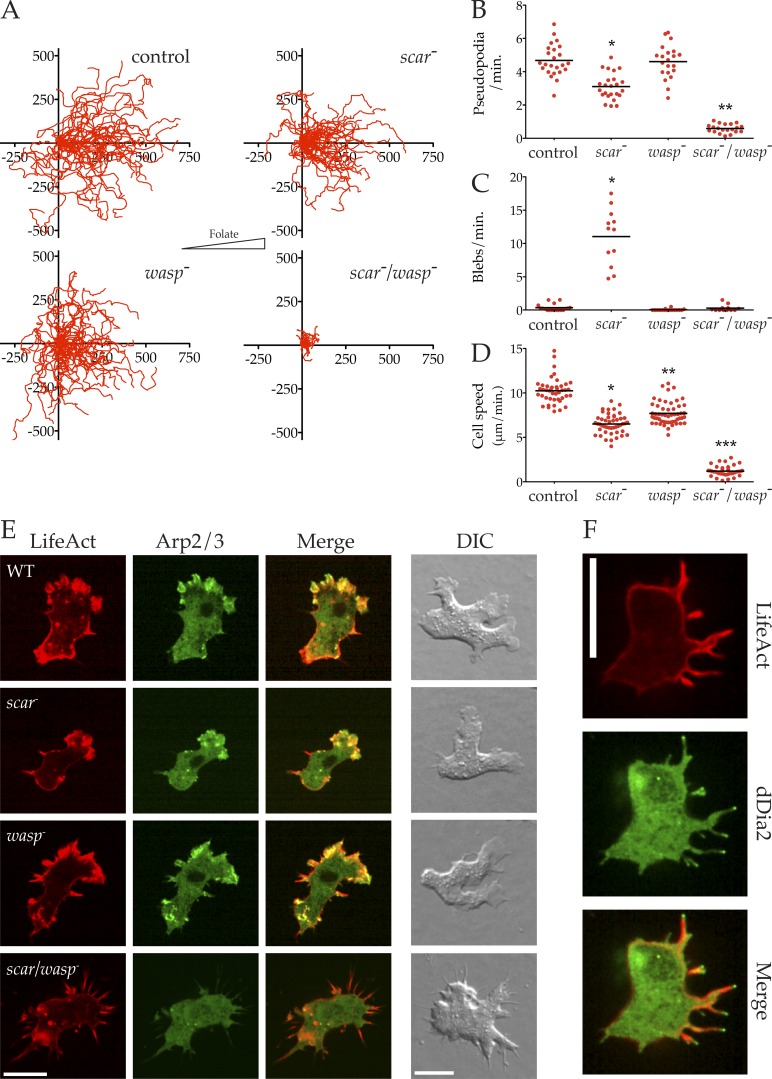
Cells lacking SCAR and WASP cannot migrate or make pseudopods. (A) The indicated cells were allowed to chemotax to folate (right) under agarose, followed by phase-contrast microscopy, and tracked as in Fig. 1 B (>20 cells/line from three independent assays; folate gradient oriented toward right; scale is in micrometers). (B) Rate of pseudopod formation. Pseudopods were counted from high-magnification DIC videos (60× oil immersion NA = 1.4). Pseudopod production is nearly abolished in double mutant (0.59 ± 0.058 vs. 4.68 ± 0.20 pseudopods/min, mean ± SEM, n > 20; P < 0.0001, one-way ANOVA). (C) Rate of bleb formation, showing that scar/wasp knockout cells lose the blebs that replace pseudopods in scar knockouts (0.29 ± 0.14 vs. 11.0 ± 1.2 blebs/min, mean ± SEM, n = 12; P < 0.0001, one-way ANOVA; control vs. scar/wasp not significant). (D) Diminished speed in scar/wasp knockout cells compared with control or single mutants. Speeds were derived from tracks in A, showing a decrease in double knockout cells compared with others (7.91 ± 0.22 vs. 6.51 ± 0.16 vs. 7.70 ± 0.17 vs. 1.21 ± 0.096 µm/min, mean± SEM; all values significantly different, one-way ANOVA, Tukey’s multiple comparison; scar/wasp vs. scar P < 0.0001, unpaired Student’s t test; n > 40). (E) Loss of recruitment of Arp2/3 complex, but not F-actin, to the edges of scar/wasp double mutant cells. Cells as indicated expressing LifeAct-mRFP (red) and GFP-ArpC4 (green) were imaged by spinning disc microscopy (Andor Revolution XD) or wide-field DIC. Bar, 5 µm. (F) The F-actin spikes in double scar/wasp mutant cells are organized by dDia2. Cells expressing LifeAct mRFP (red) and GFP-dDia2 (green) were imaged by spinning disc microscopy (Andor Revolution XD). Bar, 5 µm.

