Figure 5.
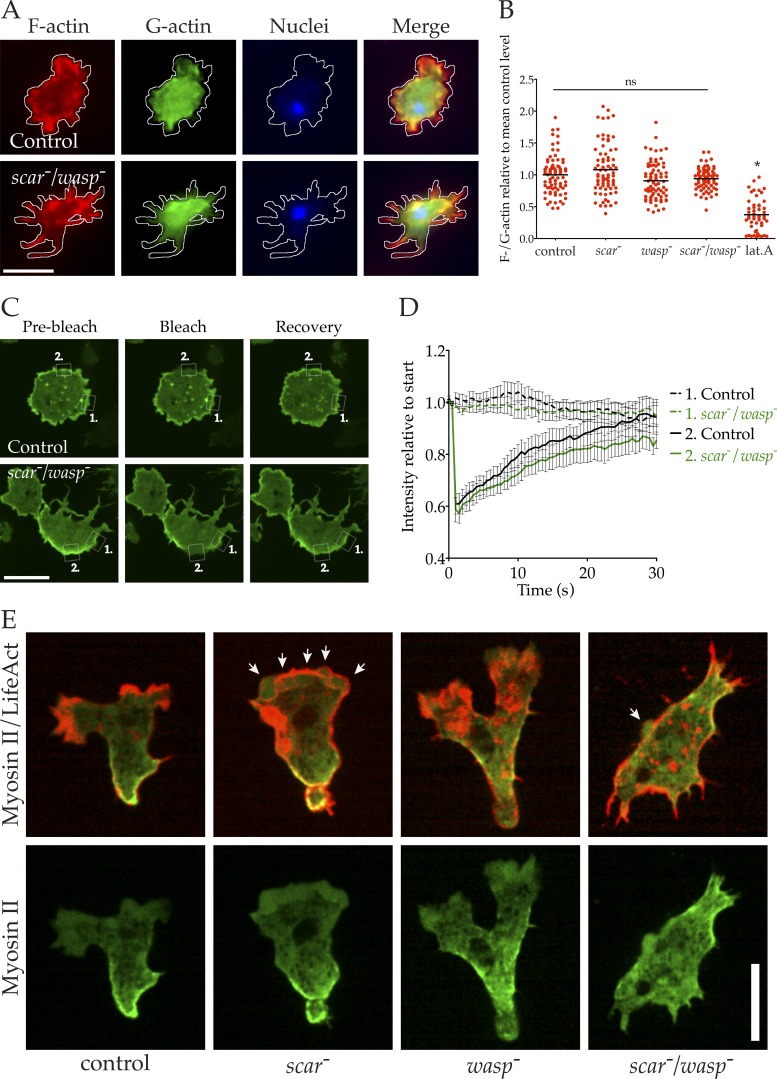
Dynamic but mislocalized actin in scar/wasp mutant cells. (A and B) F-actin content in scar/wasp mutant cells. Cells were fixed and stained with phalloidin (F-actin, red), Dnase I (G-actin, green) and DAPI (DNA, blue) and imaged using wide-field microscopy. (A) Control and scar/wasp mutant cells fixed and stained with these dyes. Bar, 10 µm. (B) F-/G-actin ratios were calculated from many images like those shown in A (n = 75) and normalized to the control mean. None of the mutants differed significantly in mean F-actin content compared with the control (one-way ANOVA, Tukey’s multiple comparison). Latrunculin A treatment of control cells significantly reduced mean F-actin content compared with untreated controls (one-way ANOVA, Tukey’s multiple comparison; P < 0.05). C, D. Cortical actin turnover in scar/wasp mutants measured by FRAP. (C) GFP-actin was expressed in control and scar/wasp mutant cells, and FRAP of cortical regions was performed (Andor mosaic FRAPPA unit). White boxes highlight cortical regions measured in (D) (region 1 = unbleached control area, region 2 = photo-bleached area). Images represent 1 s before, 0 s, and 30 s after photo-bleach. Bar, 10 µm. (D) FRAP curves derived from many cells as shown in B (n = 16), with mean fluorescence intensity of regions normalized to initial value; bars = SEM. (E) Cortical actomyosin in scar/wasp double mutants. Indicated cells expressing LifeAct-mRFP (red) and GFP-MHC (green) were imaged by spinning disc microscopy (Andor Revolution XD). White arrows indicate blebs; lat.A., latrunculin A. Bar, 10 µm.

