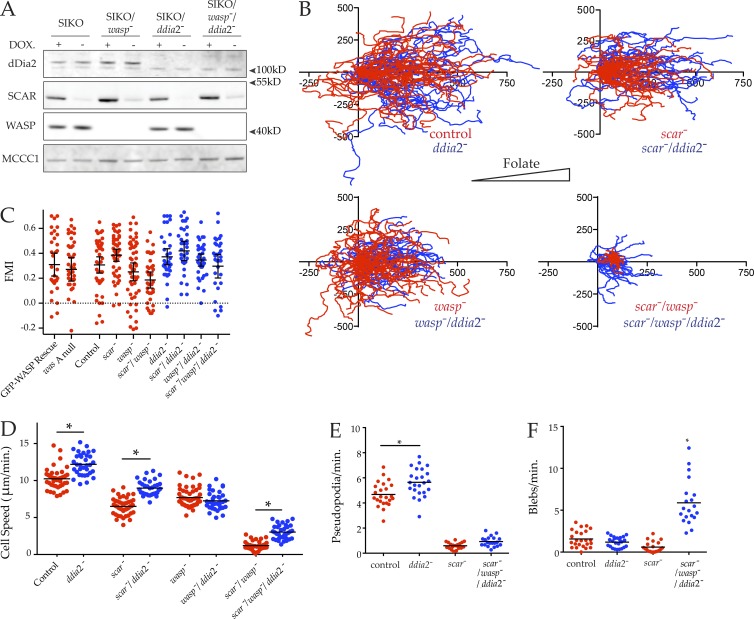
Figure 7.
Loss of a formin, as well as SCAR and WASP, restores movement. (A) Loss of dDia2, SCAR, and WASP from SIKO/wasp−/ddia2− triple mutant cells verified by Western blotting with anti-dDia2, anti-SCAR, and anti-WASP antibodies. Expression of SCAR was suppressed after 48 h in absence of DOX. Biotin conjugates were used to probe for MCCC1 to demonstrate equal loading. (B–E) Motility of scar/wasp/ddia2 knockouts is improved compared with scar/wasp knockouts. The effect of ddia2 loss in different genetic backgrounds (blue) plotted alongside data from Fig. 4 (A–D) (red) for comparison. (B) The indicated cells were allowed to chemotax to folate (right, indicated by triangle) under agarose, imaged by phase-contrast microscopy, and tracked as in Fig. 1 B (n > 30 cells/line, three independent experiments). Track length of scar/wasp/ddia2 knockouts were increased compared with scar/wasp; scale is in micrometers. (C) Forward migration index (FMI) of tracks from B. All cells were positively chemotactic. (D) Speeds were derived from tracks in B. Loss of ddia2 alone, in a scar− background or a scar−/wasp− background, significantly increased speed compared with control (12.20 ± 0.25 vs. 10.24 ± 0.22), scar− (8.98 ± 0.17 vs. 6.51 ± 0.16), or scar−/wasp− cells (3.03 ± 0.16 vs. 1.21 ± 0.10), respectively (all speeds μm/min, mean ± SEM; all values significantly different, one-way ANOVA, Tukey’s multiple comparison, P < 0.05). (E and F) Improved motility of scar/wasp/ddia2 knockouts as a result of increased blebbing as opposed to pseudopod extension. Cells were imaged while chemotaxing under agarose toward folate by DIC. (E) Rate of pseudopod formation. DIC videos were analyzed and pseudopods counted. Pseudopod formation was significantly increased in ddia2− cells compared with controls (5.65 ± 0.23 vs. 4.68 ± 0.20), but no difference was detected between scar/wasp/ddia2 and scar/wasp knockouts (0.93 ± 0.09 vs. 0.59 ± 0.06; all rates pseudopods/min, mean ± SEM, one-way ANOVA, Tukey’s multiple comparison, P < 0.05). (F) Rate of bleb formation. DIC videos were analyzed and blebs were counted. The rate of blebbing was significantly increased in scar/wasp/ddia2 knockouts compared with controls (5.88 ± 0.60 vs. 1.57 ± 0.20), ddia2− cells (1.19 ± 0.13) and scar−/wasp− cells (0.60 ± 0.14; all rates pseudopods/min, mean ± SEM, one-way ANOVA, Tukey’s multiple comparison, P < 0.05).

