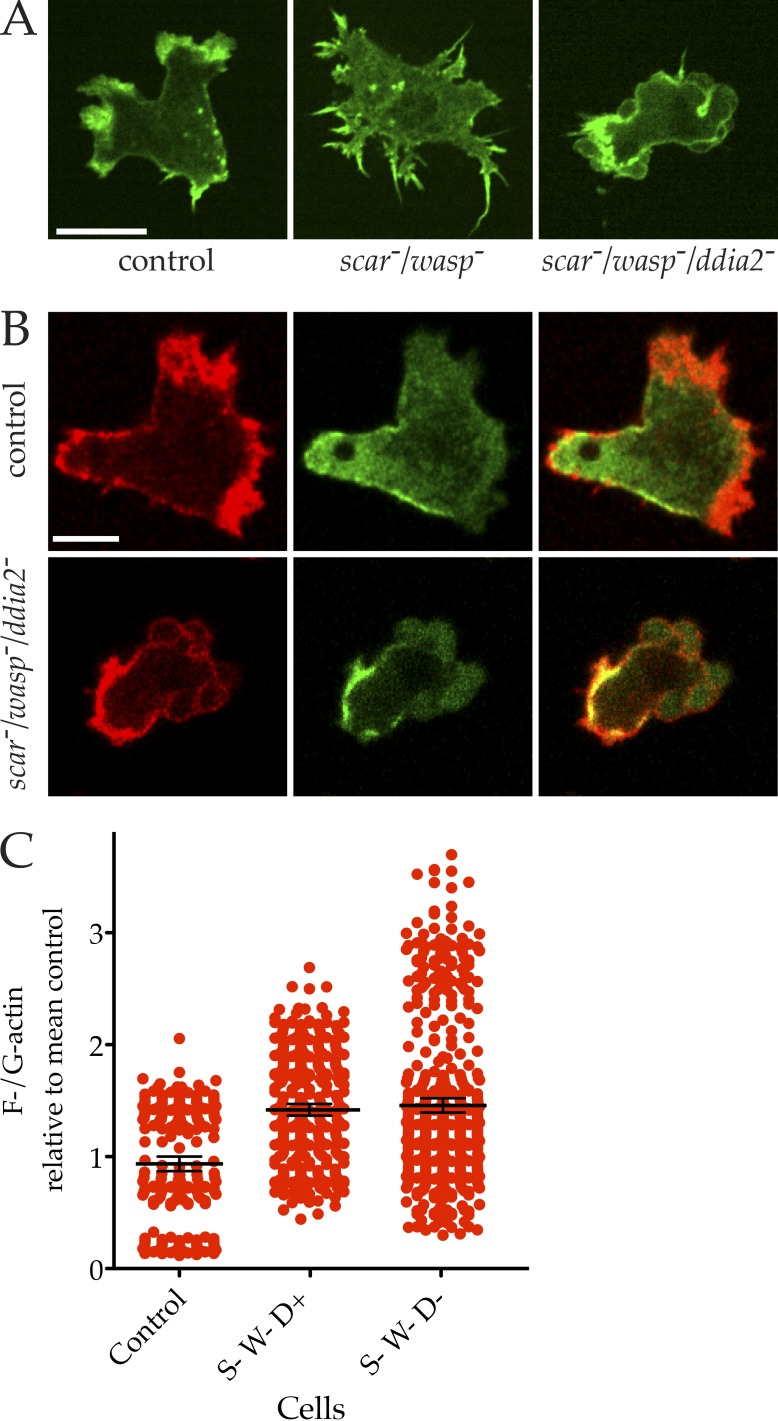
Figure 8.
Actin and myosin II in scar−/wasp− cells with and without ddia2. (A) scar/wasp/ddia2 knockouts chemotax through bona fide blebs. Cells expressing LifeAct-GFP were imaged chemotaxing under agarose by spinning disc microscopy (Andor Revolution XD). Compared with the pseudopods of chemotaxing controls and the filopods extended by immobile scar/wasp knockouts, the motility of scar/wasp/ddia2 is supported by blebbing. Bar, 10 µm. (B) Myosin II in scar/wasp and scar/wasp/ddia2 mutants. Cells were transfected with GFP–myosin II heavy chain and RFP-LifeAct, and imaged by confocal. Myosin II is clearly localized at the rear, with blebs at the front of scar/wasp/ddia2 mutant cells. Bar, 5 µm. (C) F-actin content in scar/wasp/ddia2 mutant cells (labeled S, W, and D). Cells were fixed and stained with Texas red phalloidin (F-actin) and Alexa Fluor 488 DNase I (G-actin) and imaged using confocal microscopy. Summed projections were made and the ratios of F-/G-actin calculated from many images (n = 75) and normalized to the control mean. None of the mutants differed significantly in mean F-actin content compared with the control (one-way ANOVA, Tukey’s multiple comparison).

