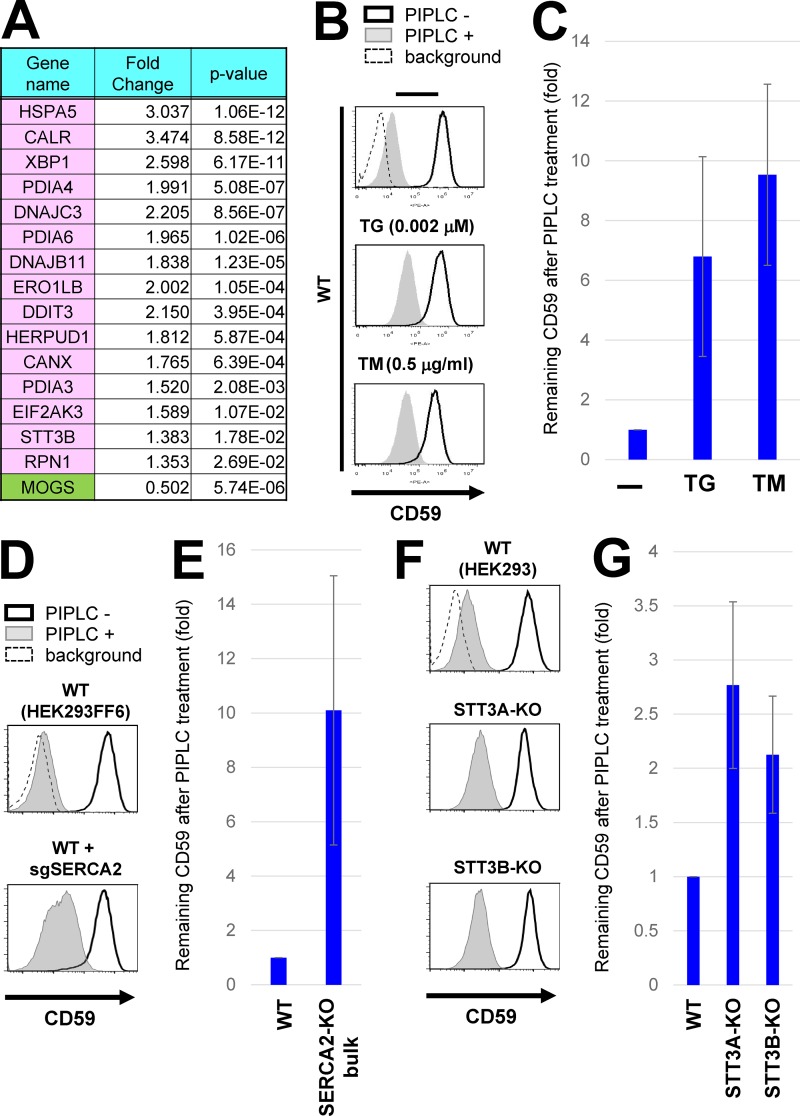
Figure 5.
Chronic ER stress induced exposure of inositol-acylated GPI-APs on the cell surface. (A) Gene expression was analyzed in WT and MOGS-KO cells using RNA-seq analyses. Among genes altered in MOGS-KO cells compared with WT cells, genes categorized in the “Protein processing in endoplasmic reticulum” in the KEGG pathway were shown in pink (up-regulation) or green (down-regulation; see Fig. S4). The MOGS gene was significantly down-regulated in the MOGS-KO cells, probably as a result of nonsense-mediated mRNA decay. (B) WT HEK293FF6 cells were treated with or without the ER stress inducer TG (0.002 µM; middle) or TM (0.5 µg/ml; bottom) for 10 d. PIPLC-treated or -untreated cells were stained with anti-CD59 antibodies. Surface CD59 was detected by flow cytometry as described in Fig. 2 A. (C) CD59 levels remaining after PIPLC treatment are plotted. (D and E) WT HEK293FF6 cells were transfected with plasmids expressing sgSERCA2 sequences to knock out the gene. Plasmid-positive cells were sorted and cultured for 10 d after transfection. WT HEK293FF6 cells and cells with bulk KO of SERCA2 were treated with or without PIPLC. Surface CD59 was analyzed by flow cytometry (D). CD59 remaining after PIPLC treatment in SERCA2-KO cells is plotted in E. The value of remaining CD59 in WT cells was set as 1. (F and G) WT HEK293, STT3A-KO, and STT3B-KO cells were treated with or without PIPLC. Surface CD59 was analyzed by flow cytometry (F). CD59 remaining after PIPLC treatment is plotted in G. In all graphs, the remaining CD59 value in untreated cells was set as 1. Relative values were calculated and are shown as means ± SD from three independent experiments.

