Figure 3.
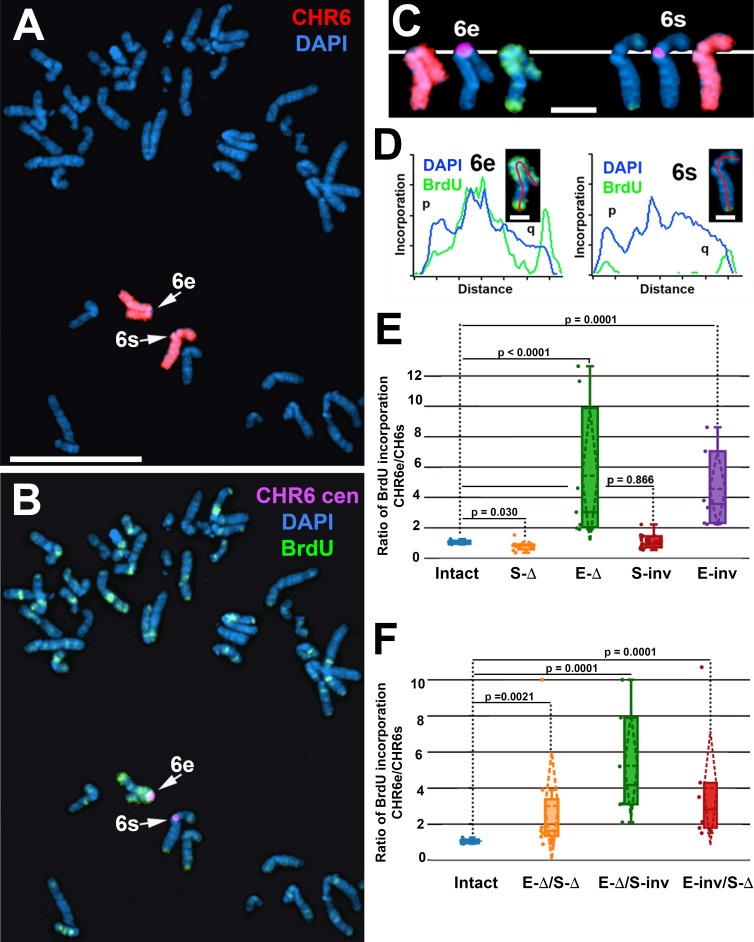
Delayed replication of chromosome 6 after disruption of the L1PA2 within ASAR6. (A–C) Cells containing a deletion of the L1PA2 from the expressed allele of ASAR6 were exposed to BrdU, harvested for mitotic cells, and subjected to DNA FISH using chromosome 6 paints (red; A and C), plus a chromosome 6 centromeric probe (purple; B and C). The larger centromere resides on the chromosome 6 with the expressed ASAR6 allele (6e), and the smaller centromere resides on the chromosome 6 with the silent ASAR6 allele (6s). DNA was stained with DAPI (blue). Bar, 10 µm. C shows isolated images of chromosome 6e and 6s from A and B. Bar, 2 µm. (D) Pixel intensity profiles of BrdU (green) and DAPI (blue) staining along the expressed (6e) and silent (6s) chromosomes from C. Bars, 1 µm. (E) BrdU quantification in cells with heterozygous deletions or inversions of the L1PA2. The ratios of DNA synthesis into the chromosome 6 homologues were calculated by dividing the BrdU incorporation in 6e by the incorporation in 6s in multiple cells. The box plots show the ratio of incorporation before (Intact, blue) and after deletion of the silent (S-Δ, orange) or expressed (E-Δ, green) alleles or after inversion of the silent (S-inv, red) or expressed (E-inv, purple) alleles. (F) BrdU quantification in cells with complex L1PA2 alleles. The box plots show the ratio of incorporation before (Intact, blue) and after deletion of the silent plus expressed (E-Δ/S-Δ, orange) alleles; after deletion of the expressed plus inversion of the silent (E-Δ/S-inv, green) alleles; or inversion of the expressed plus deletion of the silent (E-inv/S-Δ, red) alleles. In E and F, the means are shown as horizontal dotted lines, medians as solid lines, and SDs as diagonal dotted lines. The data were analyzed across categories using the ratio of incorporation in multiple cells and the Kruskal–Wallis test, with p-values indicated on the plots.

