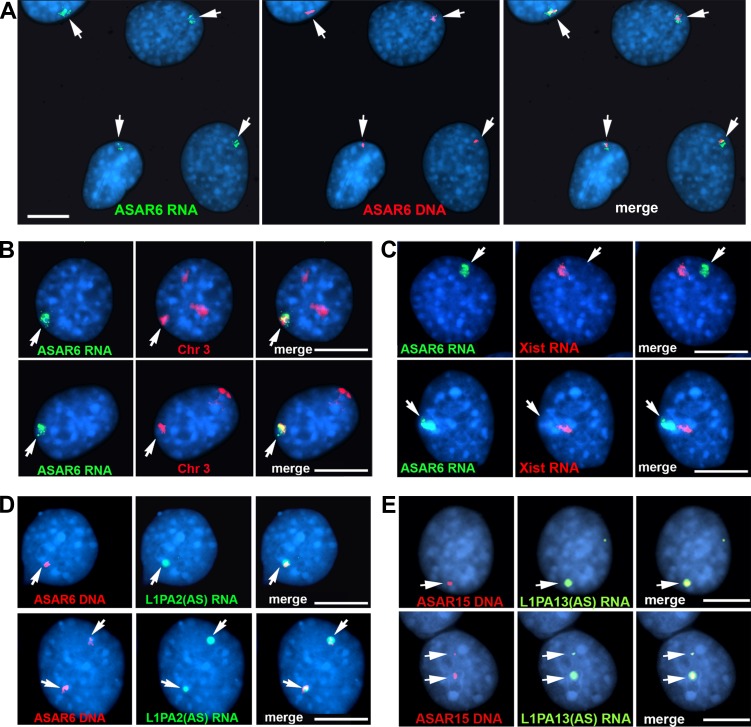
Figure 4.
ASAR6 RNA occupies chromosome territories. Mouse cells containing the ASAR6 BAC transgene were analyzed by RNA-DNA FISH. (A) Two nonoverlapping Fosmid probes were used to detect ASAR6 RNA (green; left) or ASAR6 DNA (red; middle); the right panel shows the merged images. (B) Images of two cells (top and bottom rows) analyzed by RNA-DNA FISH using a Fosmid probe to detect ASAR6 RNA (green) and a chromosome paint (red) to detect mouse chromosome 3; the right panels show merged images. (C) ASAR6 RNA compared with Xist RNA. Images of two cells (top and bottom rows) analyzed by RNA FISH using a Fosmid probe to detect ASAR6 RNA (green) and a mouse Xist cDNA probe (red) to detect Xist RNA; the right panels show merged images. (D) Strand-specific RNA FISH. RNA-DNA FISH on two cells containing the ASAR6 BAC using a strand-specific probe representing the L1PA2 sense-strand (green), and for ASAR6 DNA (red); the right panels show merged images. (E) Strand-specific RNA FISH. RNA-DNA FISH on two cells (top and bottom rows) containing ASAR15 transgene 1 using a strand-specific probe representing the L1PA13 sense-strand (green), and for ASAR15 DNA (red); the right panels show merged images. The arrows mark the sites of ASAR RNA FISH signals. Bars, 10 µm.

