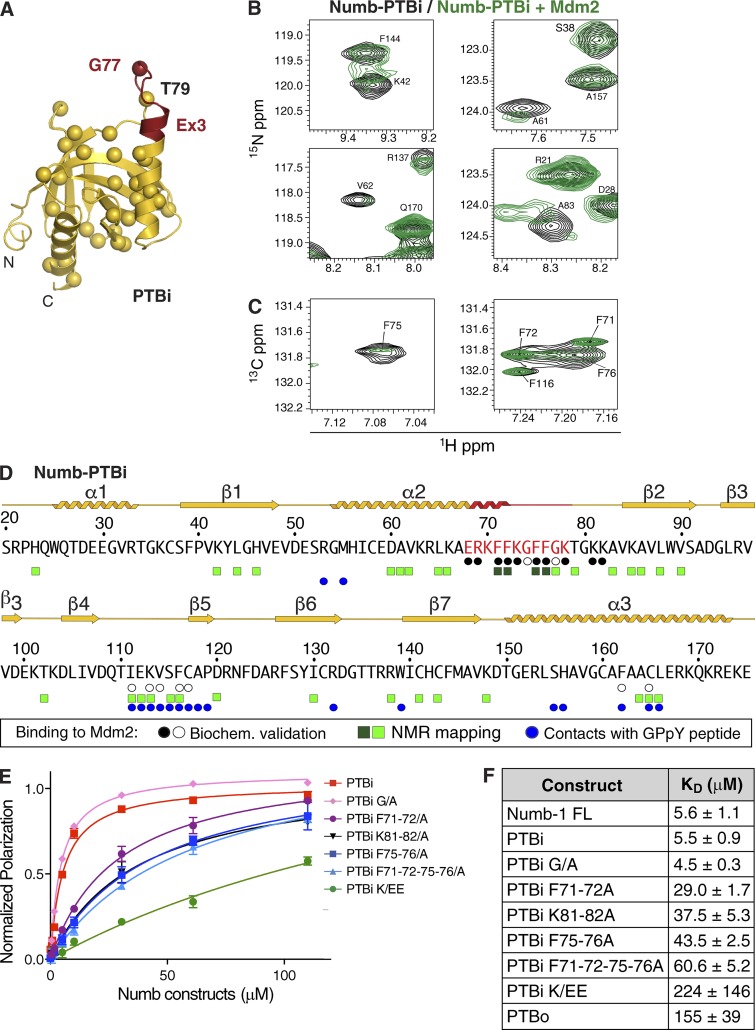
Figure 4.
Characterization of the PTBi–Mdm2 interface on the PTBi side. (A) Cartoon representation of the crystal structure of PTBi colored as in Fig. 3 A. Amides of residues experiencing chemical shift changes upon Mdm2 binding are displayed as spheres colored in red for strongly affected residues in and near the Ex3 insert. (B and C) Selected NMR signals are shown from [1H][15N]HSQC spectra of [15N] uniformly labeled PTBi (B) or for [1H][13C]HSQC spectra recorded with Phe-SAIL–labeled PTBi (C), free (black) and in the presence of 1.1–1.2 equivalents of Mdm2216–302 (green). See also Fig. S3, C and D. (D) Summary of NMR spectral changes in PTBi (CSP or line broadening) upon Mdm2 binding. Residues that show either CSPs or intensity reductions are depicted for >0.15 ppm or >1 SD of mean intensity (light green squares) or >0.3 ppm or >2 SD of mean intensity (dark green squares). Residues whose replacement abrogates or does not affect binding to Mdm2216–302 (by FP or GST pulldown experiments) are labeled with black and white circles, respectively. Residues of the PTBi contacting the GPpY peptide in the crystallographic structures are marked with blue circles. The secondary structure of the PTBi as defined by crystallographic structures and NMR data are indicated above the sequence with the same color code as in A. (E) FP measurements of the binding affinity between rhodamine-labeled Mdm2216–302 and Numb-PTBi WT (PTBi) or mutated as indicated (the PTBi curve is from the same experiment described in Fig. 2 D). The data (n = 6; means ± SD) were fitted to a curve as described in the Fluorescence polarization (FP) section of Materials and methods. (F) Summary of FP experiments (see E and Fig. 2 D) to measure the binding affinities between rhodamine-labeled Mdm2216–302 and the indicated Numb species (means ± SD). FL, full length; PTBi-G/A, G74A-G77A substitutions; PTBi-K/EE, R69E-K70E-K73E-K78E substitutions.

