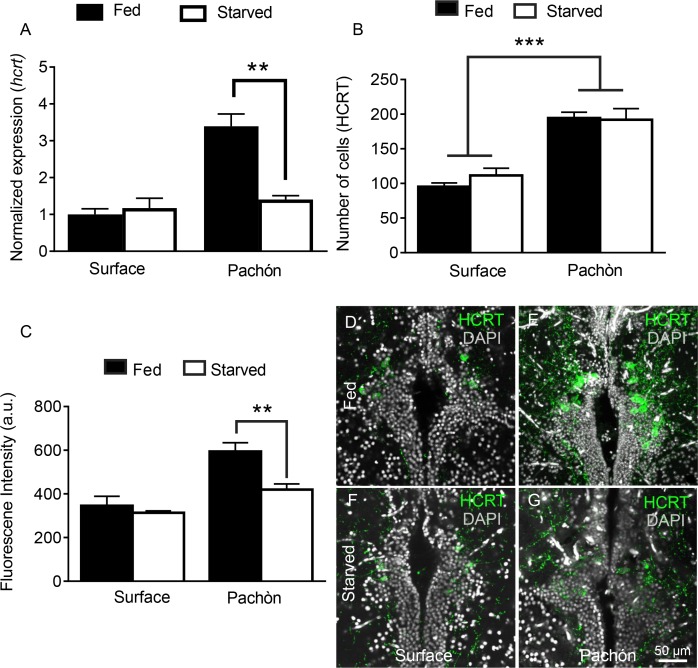
Figure 7. Starvation selectively inhibits HCRT levels in cavefish.
(A) Starvation does not affect hcrt expression in surface fish (p>0.832, n = 4) while hcrt expression is significantly reduced in Pachón cavefish (p >0.001, n = 4, 2-way ANOVA, F(1,13)=13.54)) (B) Fluorescent intensity in HCRT cells was not affected by 30 days starvation in surface fish (p>0.788, n = 4). In Pachón cavefish, HCRT neuropeptide was significantly reduced following starvation (p<0.004, n = 4, 2-way ANOVA, F(1,12)=10.17)) (C) Starvation has no significant effect on total number of HCRT-positive cells in either surface or Pachón cavefish (Surface, p=0.452, n = 4; Pachón, p>0.979, n = 4, 2-way ANOVA, F(1,11)=3.65)) (D) Surface control (E) Pachón control (F) Surface starved (G) Pachón Starved. Scale bar = 50 μm.

