. 2018 Jan 18;7:e29087. doi: 10.7554/eLife.29087

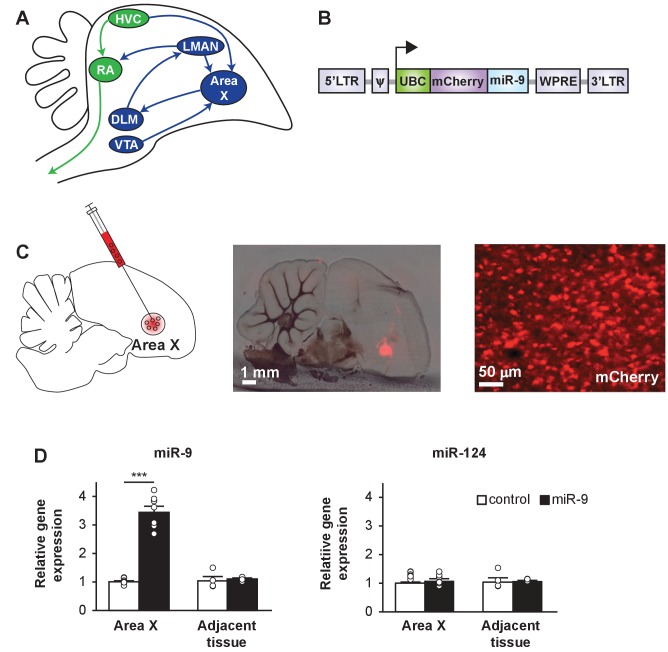
Figure 1. A lentiviral approach to manipulate miR-9 expression in Area X of the zebra finch brain.

(A) Schematic drawing of the song control circuit in the zebra finch brain. The motor pathway (green), which connects HVC (used as a proper name) to RA (robust nucleus of the arcopallium) and eventually the vocal organ, controls song production. The anterior forebrain pathway (blue), which connects HVC to the basal ganglia nucleus Area X, DLM (medial nucleus of the dorsolateral thalamus), LMAN (lateral magnocellular nucleus), and then back to RA, is required for song learning. Area X also receives dopaminergic inputs from the VTA (ventral tegmental area). (B) The lentiviral vector used in this study expresses an mCherry fluorescent marker and miR-9 driven by the human ubiquitin promoter. (C) (Left) A diagram showing viral injection into Area X. (Middle and right) Sagittal sections of the zebra finch brain showing mCherry fluorescent signal in juvenile Area X four weeks after lentivirus injection. (D) The expression of miR-9 and miR-124 in Area X 4 weeks after injection with the lenti-miR-9 virus. p < 0.0001, t(12) = 11.21 for miR-9; p = 0.2879, t(12) = 1.112 for miR-124, unpaired t-test. n = 7 for Area X; n = 4 for adjacent tissue. Data are presented as mean ± SEM.

Figure 1.

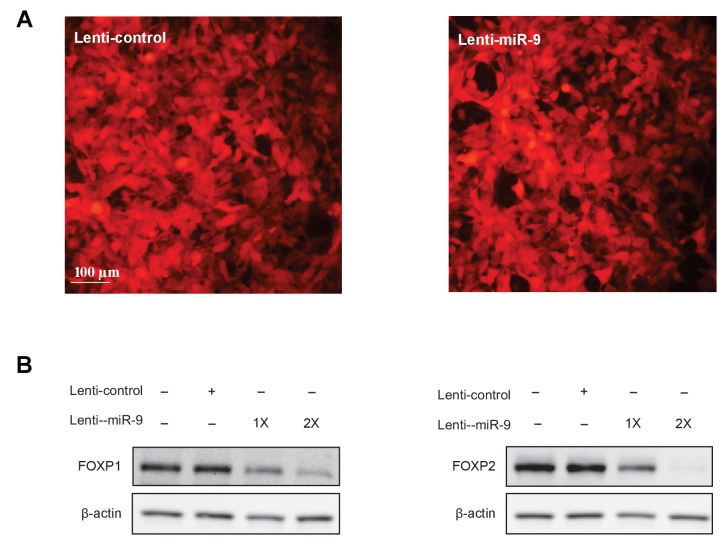
Figure 1—figure supplement 1. A lentiviral approach to manipulate miR-9 expression.

Figure 1—figure supplement 1.

(A) 293T cells infected with the lenti-control or the lenti-miR-9 virus. Note the virally expressed mCherry fluorescence. (B) Western blot analysis of FOXP1 and FOXP2 protein expression in 293T cells infected with the lenti-miR-9 or lenti-control virus. Lenti-control virus (4 µl infection) titer was 2.5 × 10⁹/ml, and lenti-miR-9 virus (4 µl and 8 µl infection) titer was 2 × 10⁹/ml. Infected cells were harvested 72 hr after virus addition. Western blot was performed using anti-FOXP1 and anti-FOXP2 antibodies. Actin was used as a loading control.

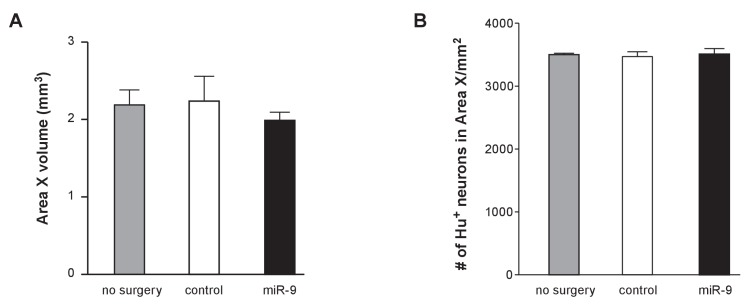
Figure 1—figure supplement 2. Impacts of viral injection on Area X volume and neuron number.

Figure 1—figure supplement 2.

(A) Area X volumes in animals receiving no injection or receiving lenti-control virus injection or receiving lenti-miR-9 virus injection. p = 0.73, F(2,12) = 0.3255, one-way ANOVA; n = 3 for the non-injected group, and n = 5 for each injected group. (B) Effect of viral injection on the number of neurons in Area X. Juveniles received viral injection into Area X at about 30 days after hatching, and Hu staining was performed one month later. Hu-positive neurons in Area X were counted using Image J software. p = 0.89, F(2,9) = 0.12, one-way ANOVA; n = 4 for the non-injection group, and n = 3 for the injected groups. Error bars, SEM.