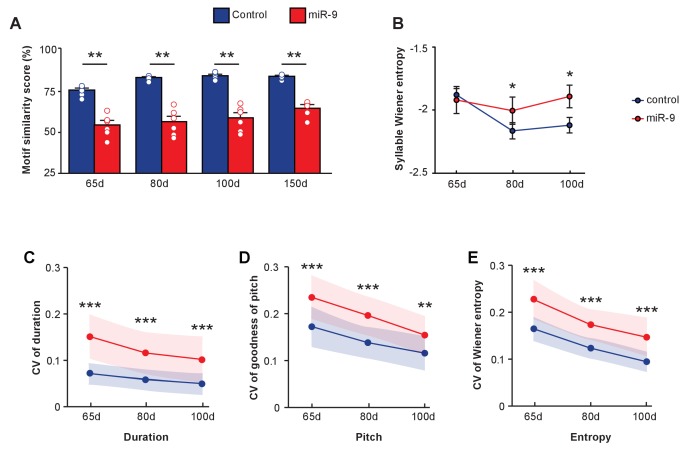
Figure 6. Developmental trajectory of vocal learning in virus-injected pupils.
(A) Motif similarity scores of the control and miR-9 pupils during developmental learning. p = 0.002, U = 0 at 65 d, 80 d, and 100 d, and p = 0.008, U = 0 at 150 d, two-tailed Mann-Whitney U test; n = 6 for all groups. For song improvement from 65 d to 150 d: p < 0.001 for control pupils, and p = 0.137 for miR-9 pupils, one-way ANOVA; n = 6 for all groups. (B) Syllable Wiener entropy of control and miR-9 pupils during developmental learning. p = 0.482, U = 500 at 65 d; p = 0.028, U = 428 at 80 d; p = 0.020, U = 417 at 100 d, one-tailed Mann-Whitney U test. For Wiener entropy reduction: p = 0.002 for control pupils, p = 0.709 for miR-9 pupils, one-way ANOVA; n = 6 for all groups. (C–E) Variation in syllable performance with respect to duration (C), goodness of pitch (D), and Wiener entropy (E) during developmental song learning in control and miR-9 pupils. The dots represent mean coefficient of variation values for each acoustic feature at each age; shaded areas represent the range of standard deviations. For comparisons between the control and miR-9 pupils: p < 0.0001 for all acoustic features at all ages except p < 0.01 for pitch at 100 d, two-tailed Mann-Whitney U test. For variability reduction: p < 0.001 for duration, goodness of pitch, and Wiener entropy for both control and miR-9 pupils, one-way ANOVA. In (B–E), control pupils: n = 42 syllables, 6 animals; miR-9 pupils: n = 25 syllables, 6 animals at each age. Data are presented as mean ± SEM.


