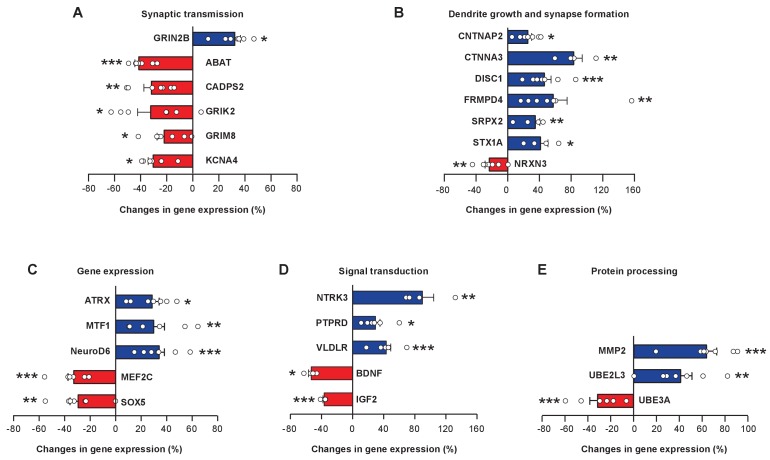
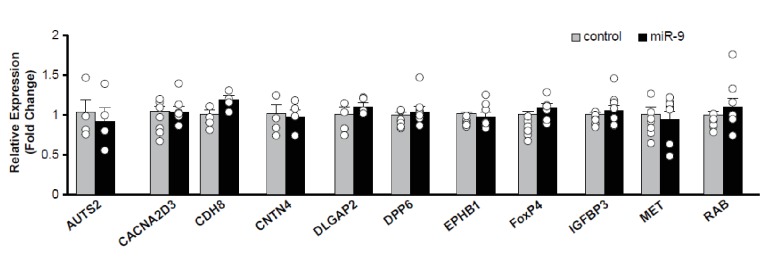
Figure 8. miR-9 overexpression alters expression levels of numerous FoxP1 and FoxP2 downstream target genes in Area X.
Blue bars, upregulated genes; red bars, downregulated genes. Genes are grouped into five functional groups: (A) neurotransmitter receptors and channels; (B) proteins involved in dendritic growth and synapse formation; (C) transcription factors; (D) signaling molecules; and (E) proteins for protein processing and degradation. Reverse transcription and qRT-PCR were performed twice, and qRT-PCR was performed in triplicate. *p < 0.05, **p < 0.01, ***p < 0.001, unpaired t-test; n = 7 for all genes, except for BDNF, CTNNA3, NRTK, and STX1A, n = 4. Data are presented as mean ± SEM.


